Tag: gas

Energy Flows in Wood Gasification Plant

Most Sankey diagrams I find on the web are from Germany, Switzerland or Austria. Anybody in the know, if this due to the visualization type being part of the engineering curriculae in these countries?

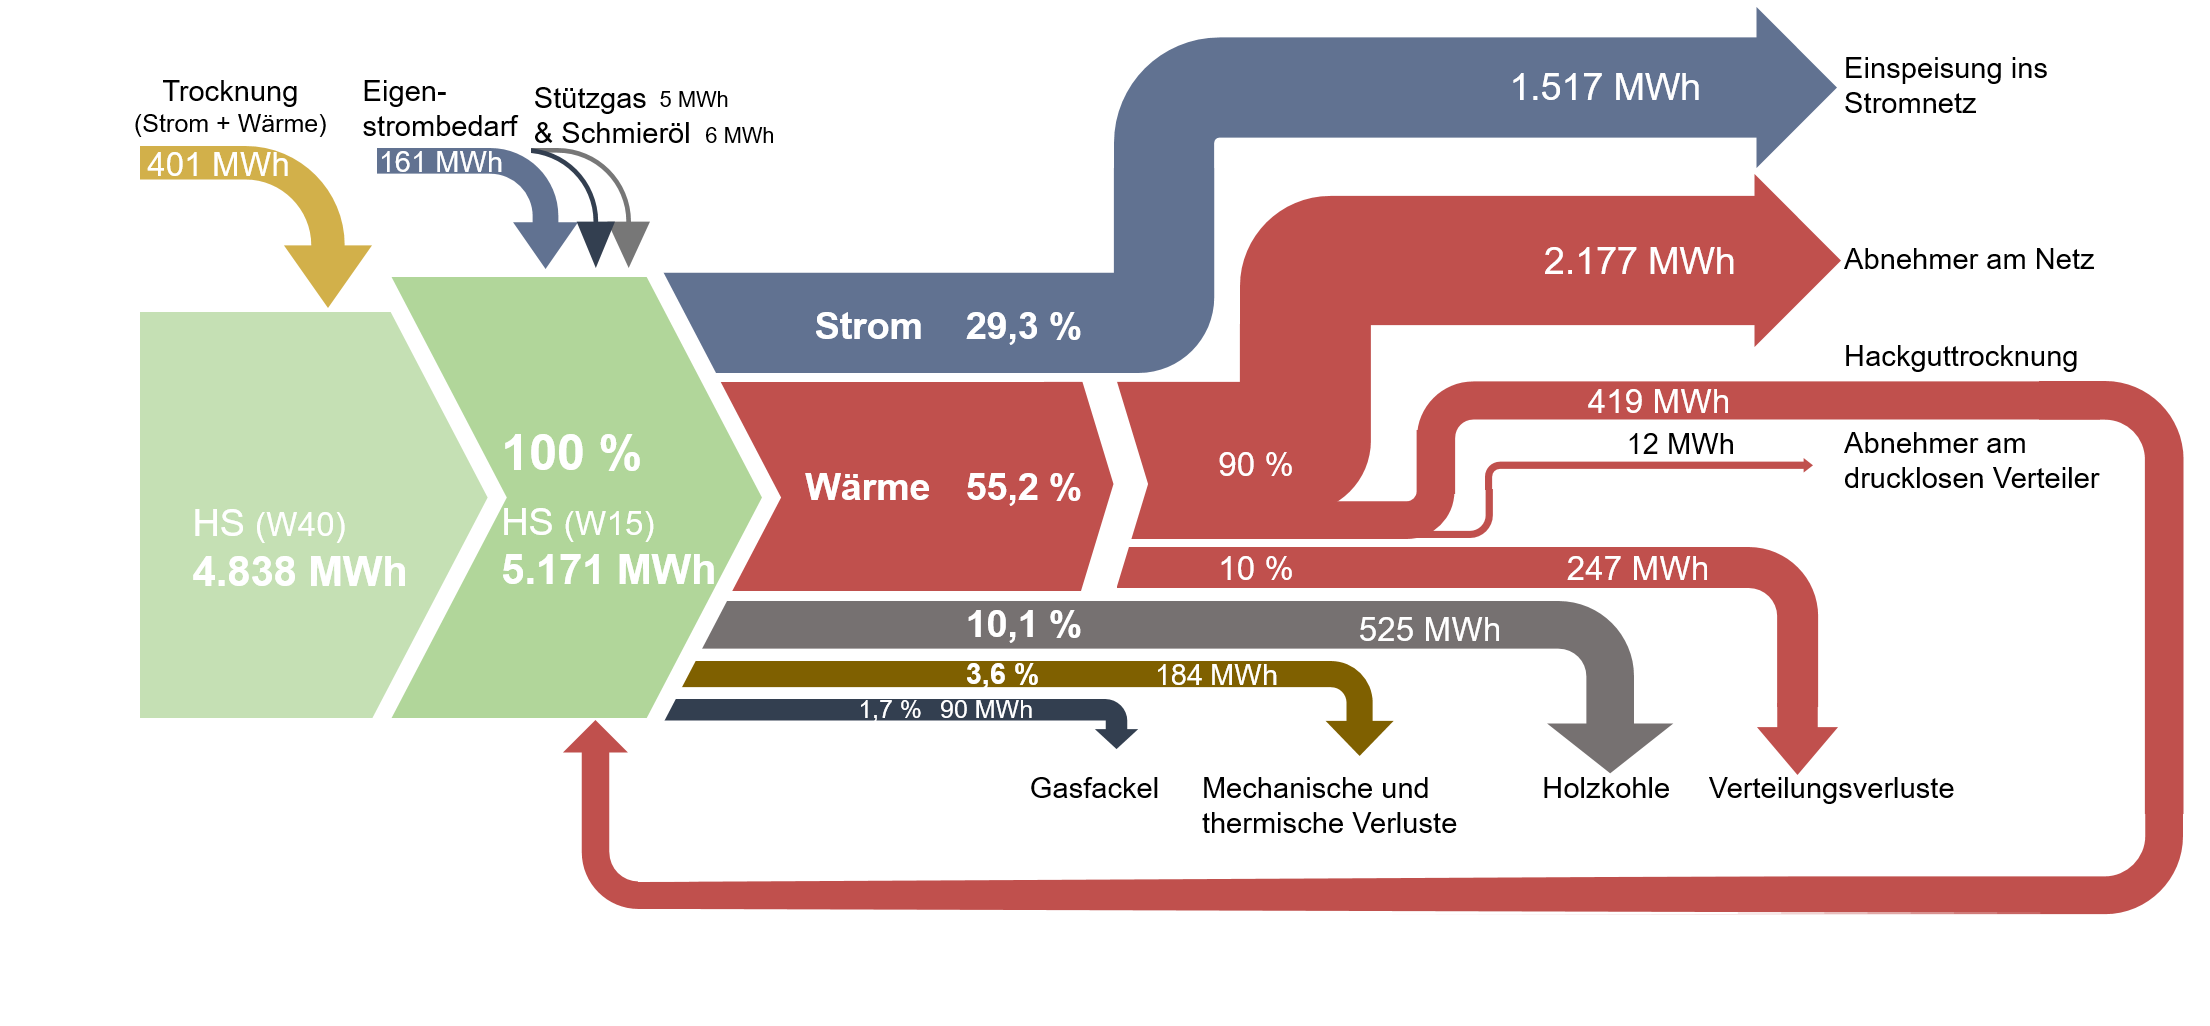
Here is one I found on ‘The Wood Power Plant’ blog by Austrian firm Syntec. It is originally taken from a student master thesis on ‘Life Cycle Analysis of Electricity and Heat Generation of a Wood Gasification Plant including District Heating Network’ (German title: ‘Lebenszyklusanalyse der Strom- und Wärmeerzeugung einer Holzvergasungsanlage inklusive Nahwärmenetz’, thanks Google Translate – you are my friend!) by Elena Käppler of University of Applied Sciences Vorarlberg.

While being graphically quite appealing there are some issue with this Sankey diagram. Flows don’t seem to add up correctly: for example the main stream 4.838 MWh and the 401 MWh coming in at the top would be larger than 5.171 MWh.
Also, some flows are not true to scale. Check out the red arrow representing 247 MWh (going down to ‘Verteilungsverluste’) and compare it to the red one going back in a loop, which represents 419 MWh (‘Hackguttrocknung’).
P2G: better done at home or offshore?

Great find by a follower of this blog who send me a link to this report in German available on the website of the German EPA (‘Umweltbundesamt’). The title translates as ‘Climate protection and regeneratively generated chemical energy carriers – infrastructure and system adaptation for the supply of regenerative chemical fuels from domestic and foreign regenerative energies’.

The report contains Sankey diagrams on 40 pages (!) like the two shown below. All of them are structured the same way with a vertical layout: a certain amount of energy available at production site, losses branching out to the right, and useful energy available on site shown as the remaining arrow at the bottom (colored in green).

From the management summary in English we learn that “this project aims at gaining first insights into the potential of renewable chemical fuels from renewable energy sources both domestic and abroad as well as the associated transport requirements. (…) [P]otentials and transport infrastructure for using renewable energy to provide storable energy carriers were analysed, being followed by a systematic comparison of the import routes of renewable gases, namely hydrogen (eH2) and methane (eCH4)”.

The assumption is that there are countries (e.g. Norway) that may have wind energy in excess, and regions (e.g. Turkey, Spain) where there is abundant potential for solar energy (PV). This electricity could be used for methanisation (power-to-gas, P2G). Gas from renewable energy could be stored in the German gas grid. The Sankey diagrams then show power-to-gas transformation on site and transporting the gas through pipelines to Germany, compared to the scenario of transporting electricity on the grid (with the associated losses) and to produce methane in Germany.

‘Klimaschutz und regenerativ erzeugte chemische Energieträger – Infrastruktur und Systemanpassung zur Versorgung mit regenerativen chemischen Energieträgern aus in- und ausländischen regenerativen Energien’ by Stefan Schütz of DBI Gas- und Umwelttechnik, Leipzig and Philipp Härtel of Fraunhofer-Institut für Windenergie und Energiesystemtechnik, Kassel. Report published Aug 2016 by German EPA (Umweltbundesamt, UBA). Download full report PDF here.

Thanks Axel from Germany for pointing me to this.

Energy Flows in Wood Gas Process

From a presentation by Swiss company CTU Clean Technology Universe AG comes this Sankey diagram for energy flows in a wood gas process.

The diagram is set up for wood with 50% humidity and an energy content of 1 MJ. The process steps drying, gasification, methanation, CO2 removal yield gas with an energy content of 0,71 MJ (71%). Much of the offheat is recovered in the process, excess heat is fed to district heating.

Wood in brown, gas in orange, heat in red and electricity in blue.

Another Sankey diagram for wood gas here.

Rosenheim wood gasifier more efficient

Interesting comparative Sankey diagram on page 16 of the 2012 environmental declaration of Rosenheim Stadtwerke (Rosenheim City Power?).

The city is building or already running a wood gasification plant. Instead of just using the heat from directly burning wood (with 30% energy loss), they decided to work with a wood gas carburetor and use the wood gas to run a gas motor. This is somewhat similar to CHP where heat and electric power can be produced. Overall loss of energy (“Verluste”) in the system is only 23%.

The green box at the bottom displays the avoided fossil GHG emissions per tonne of wood for both technologies.

Flows are in MWh, but only some selected arrows are labeled. Unfortunately the flows are not always to scale: yellow arrow “Wärme” (heat) in figure at top representing 3,15 MWh, but shown as half the width of the blue arrow 4,5 MWh. I reckon the diagram was build manually from rectangles and triangles.

Wind to Gas Sankey Diagram

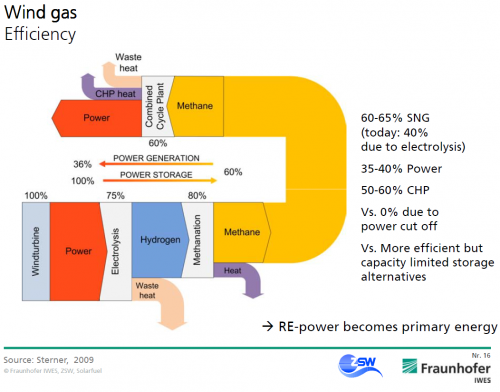
Didn’t know what wind gas was until I saw this presentation on “Towards 100% renewables and beyond power: The possibility of wind to generate renewable fuels and materials” by Michael Sterner of Fraunhofer IWES institute. Page 16 has this diagram:

The process described is actually a way of storing energy. Electricity from wind power is used to produced hydrogen and converted to methane. As such it can be stored (e.g. in gas pipelines) and is available to generate electric energy during peak hours. Efficiency is only 36%, but alternatively wind turbines would have to be cut-off if they can’t feed their power into the grid. Other storage alternatives (such as pumped storage power) are capacity limited.

An overall interesting presentation, access the PDF here.