Tag: ISO50001

Sankey Diagram in Energy Management

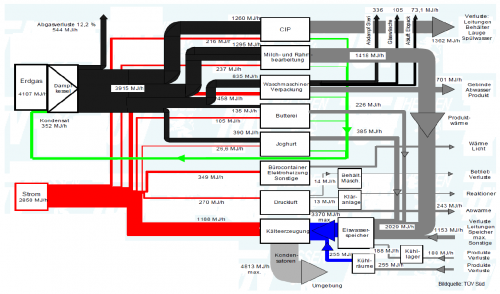
From a presentation on energy management held by Thomas Keller of Ecowin (available at the KNUT Hessen website) comes the following Sankey diagram.

The diagram is in German, but I get the main point: Energy and heat consumption in a company in MJ per hour. Fuels are natural gas (black streams) and electricity (red streams). The white boxes are the processes consuming the energy. Grey flows are transformed energy or losses.
Data seems to come from a energy management software with measuring devices installed along the production line. The company is about to obtain ISO 50001 certification.

I have recently noticed an increased use of Sankey diagrams in ISO 50001 case studies. Hope to see more of them coming.
Energy Management in a Company

Even before the 2011 release of the ISO 50001 energy management standard, which lists Sankey diagrams as one tool for energy analysis, companies and consultants have been using them in energy efficiency and energy management projects. Many published examples come from Austria, like this one.

Below is a Sankey diagram example for Austrian company ‘Joh. Pengg AG’ from a 2005 report published by Austrian Federal Ministry for Traffic, Innvation and Technology (bmvt): (H. Bayer: ‘Abwärmenutzung und Einsatz Erneuerbarer Energieträger in einem metallverarbeitenden Betrieb’, Report in German, Sankey diagram on p. 34).

All flows in kWh, total energy consumption for the year 2003 is 45,35 Mio. kWh. The red flows are for electric energy, the yellow ones for energy from natural gas. The middle column has the different equipments that consume energy within the company. Useful energy quantities (“Genutzte Energie”) are shown in orange, while losses are outputs in pink that are visually “collected” and joined again in the last node. Not sure what the light blue part stands for.