Tag: Latin America

LatAm BEN – Argentina

Recently I have been reading about energy policies in Latin American countries. Quito-based OLADE, the inter-governmental Organización Latinoamericana de Energía plays a key role in coordination and cooperation between countries in regard to energy.

OLADE has also established the SIER (Sistema de Información Energética Regional), and one of their products is SieLAC (Sistema de Información Energética de Latinoamérica Latina y el Caribe) where energy data for 27 countries can be accessed.

For all countries the national energy balance (Balance Energético Nacional, BEN) can be produced as Sankey diagrams for the years 2005 through to 2010. Further, these energy flows can also be shown for regions, such as the Caribbean, the Andean countries or the “Southern Cone”.

Here is the one for Argentina in 2010.

To try for yourself, just go to the sieLAC page and click on ‘Balance Energético Resumido’. Then select country, year and the unit.
Unfortunately, data for more recent years is not available at this time.

This work of OLADE has inspired me to start a loose mini-series of posts titled ‘LatAm BEN’ where I will be showing Sankey diagrams representing national energy balances from the region. Don’t worry, they will not all be from SieLAC, and will show how differently BENs can look like.

What’s in a Book? Sankey Diagrams!

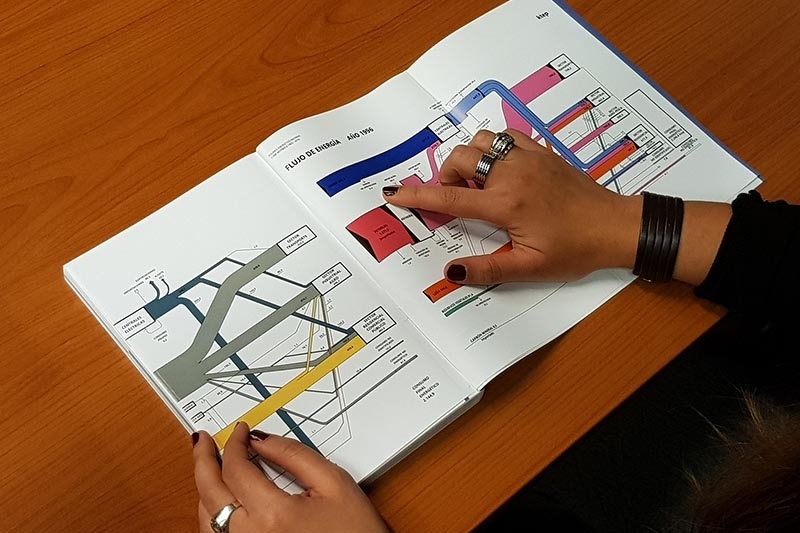
I would love to get a copy of the book shown in the picture below… but then it is probably just a symbolic photo of someone studying the energy balance of a country (the caption reads “Energy Flows Year 1996”).


This find has inspired me to a new mini-series of posts on national energy balances shown as Sankey diagrams with a focus on Latin America.

Here is the list with links to all post so far:
Argentina: 2010
Bolivia: 2014
Brazil: 2014
Chile: 2015
Colombia: 2012
Costa Rica: 2010, 2015
Ecuador: 2017
Guatemala: 2011
Honduras: 2017
Mexico: 2011 and 2016 (coming up)
Panama: 2018
Paraguay: 2017
Peru: 2009, 2017
Uruguay: 2015

Update 04/2020: I am still looking for energy balances for a number of Central American countries (Nicaragua, El Salvador) and for Venezuela on the southern cone. If you can point me to some sources, please leave a comment below.

Chile Energy Balance 2015

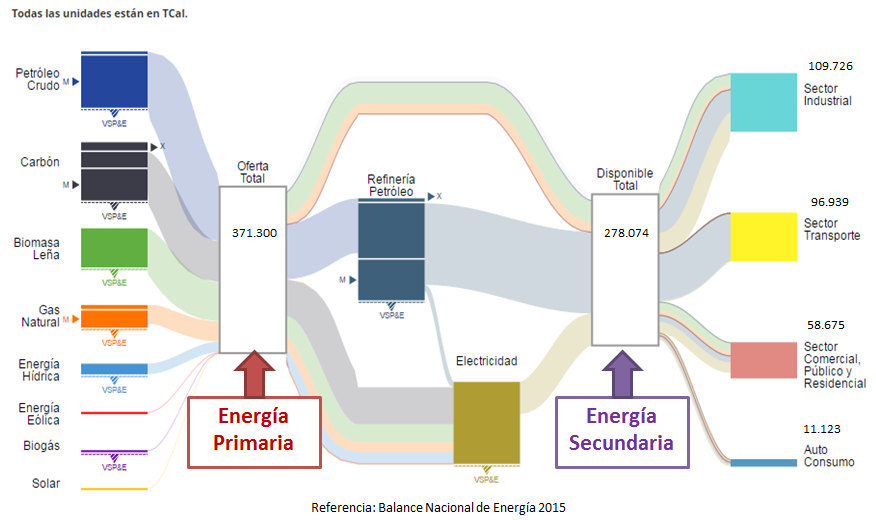
This Sankey diagram depicting the energy balance of Chile for 2015 can be found on the website Gestiona Energía MiPyMEs (MiPyMEs is the Spanish term for ‘small and medium-sized enterprises’, SMEs).

Flows are in TCal (teracalories), a unit for energy we don’t get to see very often (1 TCal = 4,205 Joules). What surprised me most in this figure was that ‘Biomasa Leña’ (biomass firewood) is the third most used primary energy source. The accompanying pie chart on the same page confirms that crude oil (25%) and coal (20%) are the most important sources, followed by biomass and oil derivates (each 19%). I guess this should read ‘biomass AND firewood’ rather than ‘biomass firewood’.

Some design shortcomings, in particular where the downward sloping stacked Sankey arrow turns to run horizontally to join the node ‘Electricidad’, and at the input side of the primary energy box, where the flows for ‘Petróleo Crudo’, ‘Carbón’ and ‘Biomasa Leña’ overlap and somehow don’t seem to hold their width all the way. My guess is that this is owed to the wish to keep the figure as compact as possible.

Addendum 11/2018: The energy balance Sankey diagram for Chile can be produced at the Energía Abierta website of The Chilean National Energy Commission.

Minerals Exports from Latin America

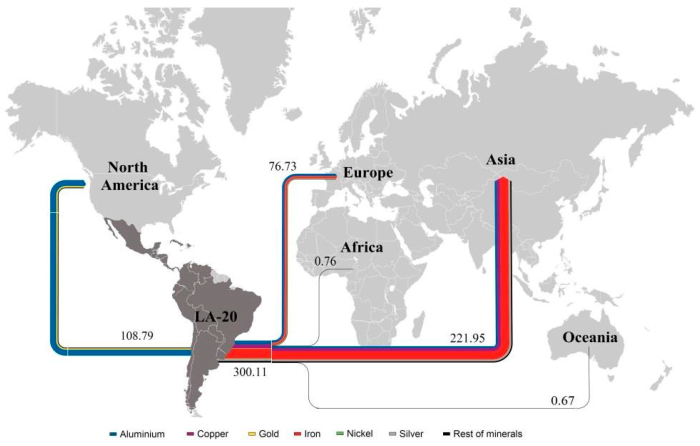
Another Sankey diagram from the article ‘Exergoecology Assessment of Mineral Exports from Latin America: Beyond a Tonnage Perspective’ by Jose-Luis Palacios I discussed in this recent post.

Non-fuel minerals exported in 2013 from Latin America to other continents. Flows are in Mtoe (for the reason why these flows are measured with a typical energy unit and to learn about the ERC approach read the article). Due to the scale, some minerals can not be seen as individual flows in the Sankey diagram and are thus grouped as ‘Rest of Minerals’ (black stream).

Minerals Exergy Replacement Costs

Another example for a Sankey diagram on a map from an article ‘Exergoecology Assessment of Mineral Exports from Latin America: Beyond a Tonnage Perspective’ by Jose-Luis Palacios (Escuela Politécnica Nacional, Quito, Ecuador) et al. published in Sustainability 2018, 10(3), 723 as open access article distributed under Creative Commons Attribution (CC BY) license.

I had not heard of the term ‘exergoecology’ before:

Exergoecology is the application of the exergy analysis in the evaluation of natural fluxes and resources on earth. The consumption of natural resources implies destruction of organized systems and dispersion, which is in fact generation of entropy or exergy destruction. This is why the exergy analysis can describe perfectly the degradation of natural capital.
The thermodynamic value of a natural resource could be defined as the minimum work (exergy) needed to produce it with a specific composition and concentration…
(Source: Exergoecology Portal)

The authors of the article argue that the Material Flow Analysis (MFA) approach should be combined with a measure for the thermodynamic quality of minerals, “especially when dealing with non-fuel minerals”. They propose to use the indicator exergy replacement costs (ERC) from exergoecology because it “considers the scarcity degree of the commodities in the crust and the energy required to extract them. When a mineral is scarcer and its extraction and beneficiation processes are more difficult, its ERC value becomes higher”.

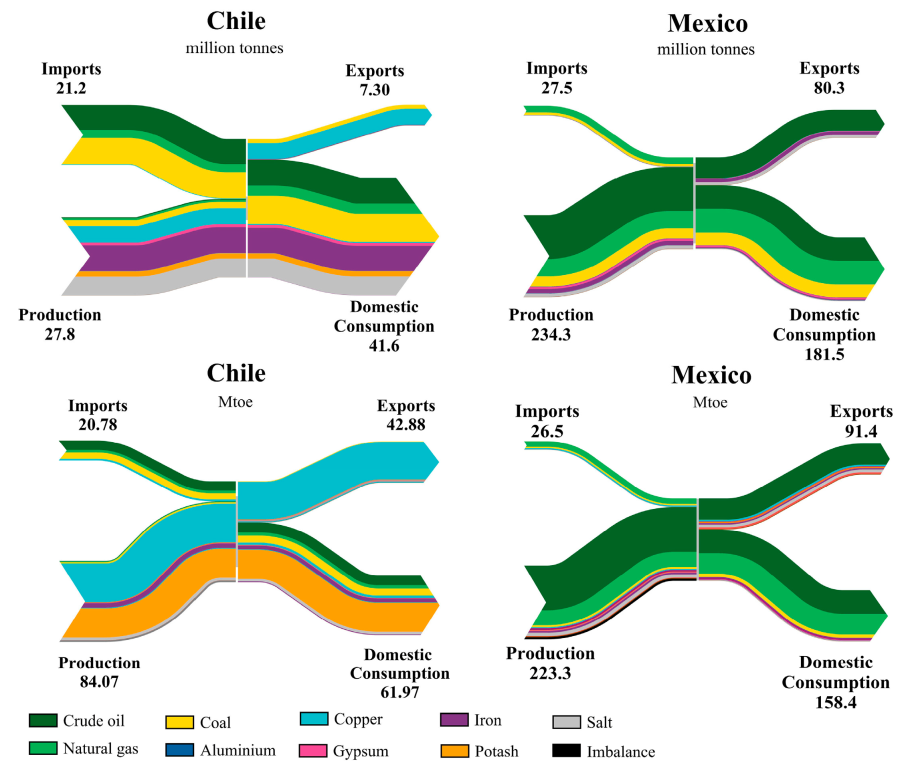
These two sets of Sankey diagrams visualize this approach:

The two Sankey diagrams on the left are for Chile, the two on the right for Mexico.

The figure at the top is a common mass-based figure, showing minerals production, imports, domestic consumption and exports for certain minerals. The unit of measure is million tonnes per year (in 2013).

The one at the bottom shows exergy replacement costs (ERC) measured in million tonnes of oil equivalent (Mtoe). For each mineral an energy indicator in GJ per tonne of element has been applied, representing the work (energy) to extract the mineral.

In the case of Chile we can see for example that iron, copper and salt are the minerals mined in largest quantities (mass-wise). However, iron and salt only make up a small fraction of ERC, while copper and potash dominate the picture. In other words: Potash has a high exergy replacement cost to produce given the work effort required to mine it and in face of its scarcity. Copper comes in second.

For Mexico the figure a the top and below look pretty similar in regard to the proportions of each of the colored flows. One could say that the minerals are similarly difficult or expensive to extract. Coal (yellow band) is comparatively wider in the mass flow diagram than in the exergy replacement costs diagram, so it is “cheaper” in regard to exergy cost to be mined.

Many more interesting details to discover and the article is well worth reading. In my oponion a fascinating blend of two approaches and a great use for Sankey diagrams.
Yet Another ‘Flujo de Energia’ Diagram

The INCyTDE blog article that featured the Energy Balance for Guatemala presented in a post last week also contains two other energy flow diagrams from other Central American countries.

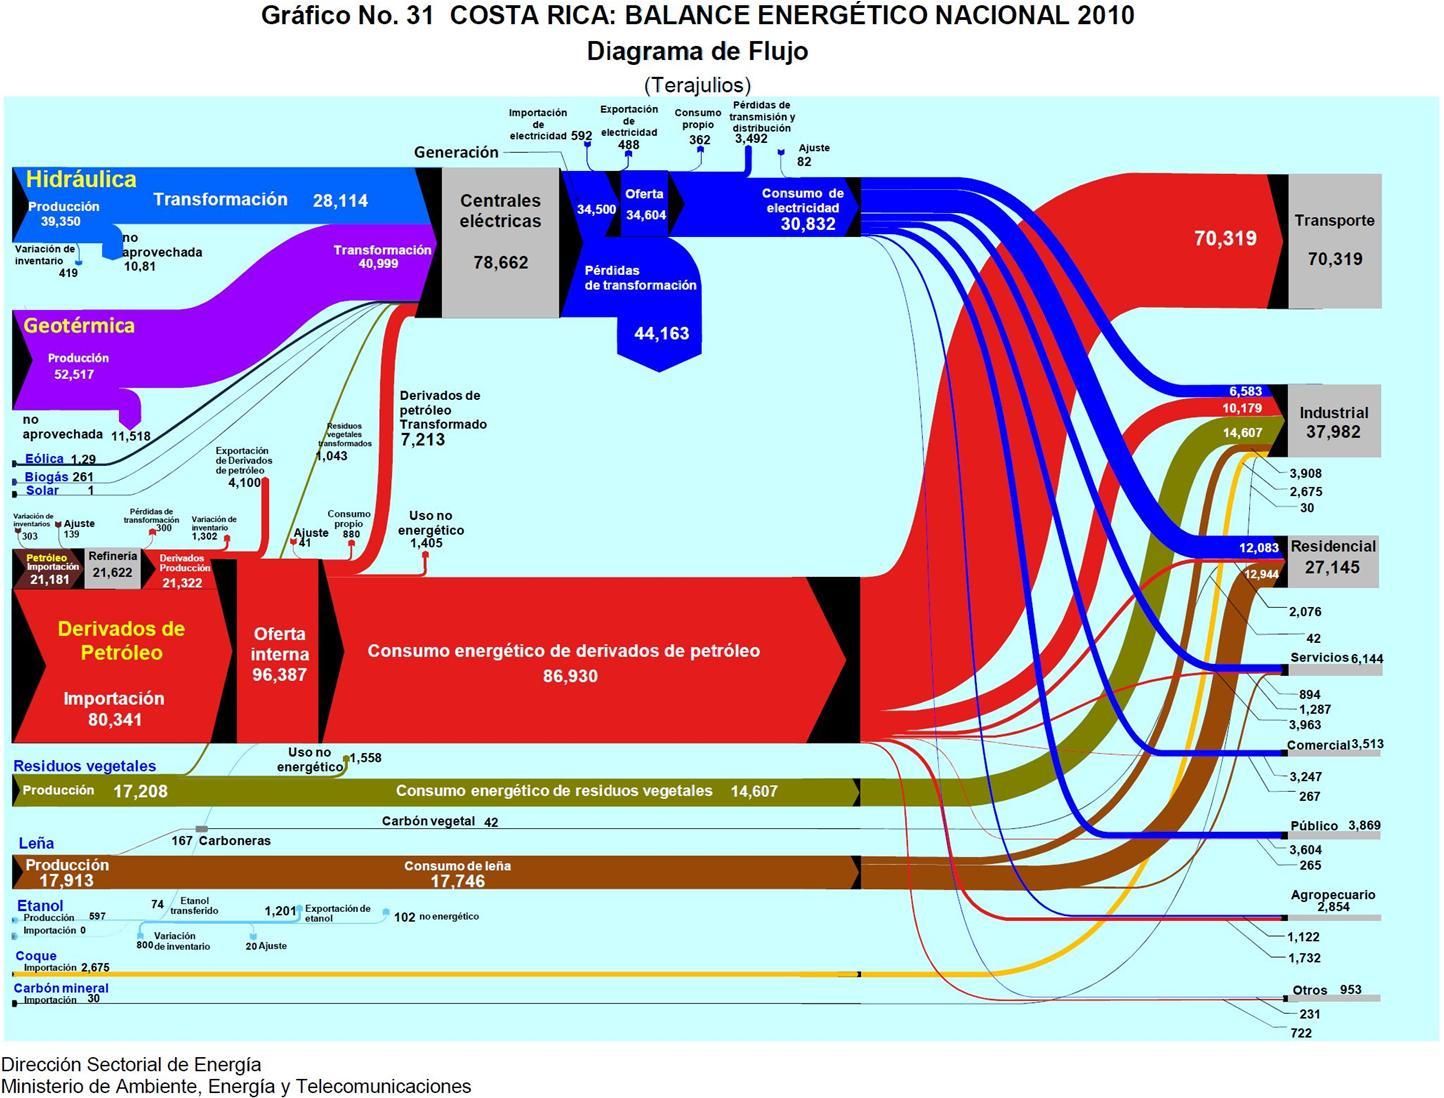
Here is the energy flow Sankey diagram (Balance Energetico Nacional) for Costa Rica for the year 2010.

In contrast to the situation in Guatemala, the dominating fuel is petroleum. The other two important feeds are from hydro and geothermal. Wood is used as heat source in private homes (17,746 TJ), and, with about the same amount, biowaste (residuos vegetales) constitutes an energy source for industry (17,607 TJ).

Flows are in TJ. The diagram is provided by the Ministry for Environment, Energy and Telecommunications.

And this time the diagram is impeccable…

Energy Balance for Guatemala

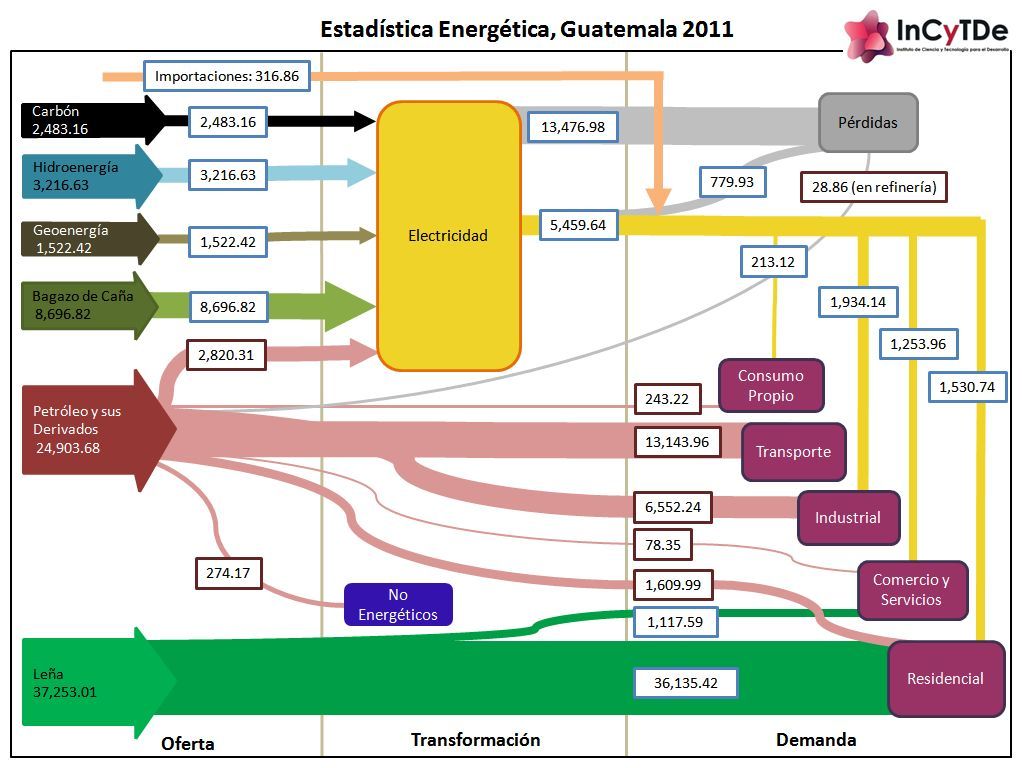
The research institute with the hard-to-pronounce acronymic name INCyTDE (Instituto de Ciencia y Tecnología para el Desarrollo at Universidad Rafael Landívar in Guatemala) has published a Sankey diagram with the energy flows for their country for the year 2011.

In regard to design the diagram has many issues: Apparently it was created using a drawing tool that supports primarily horizontal and vertical arrows and Bezier curves. But the diagram loses a lot with branching and joining of arrows almost non-existent.

Flows are more or less to scale. The unit is not shown in the diagram itself, but explained in the text (kilo barriles equivalentes de petróleo, KBEP = kilo tonnes of oil equivalent, ktoe). Data is from national statistics published by the Energy and Mining Ministry.

The content of the energy balance diagram is quite interesting, especially if you compare it to similar diagrams of other countries or the world average.
Wood is the most important energy in Costa Rica (green arrow ‘Leña’, 37.251 ktoe in 2011). Bagasse from sugar cane (dark green arrow ‘bagazo de caña’, 8.696 ktoe in 2011) is used for almost half of the electricity generation. Petroleum and derivates (dark pink arrow, 24.903 ktoe in 2011) however do play an important role for vehicles (transportation).