Tag: Norway

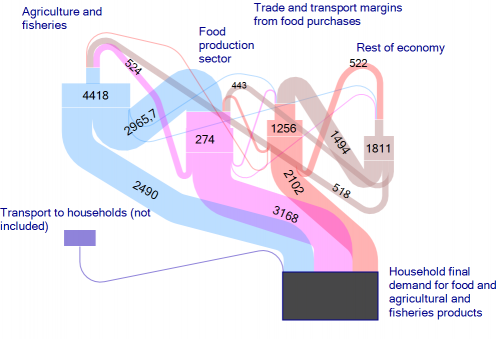
Norway Food Supply Sankey

From a book ‘Environmental and climate analysis for the Norwegian agriculture and food sector and assessment of actions’ by John Hille, Christian Solli, Karen Refsgaard, Helge Berglann, Knut Krokann published on ResearchGate.

Download the full book on ResearchGate.

Not sure about the unit of flows.The unit of flows is kT CO2-eq./year (see comment by Christian Solli). The Sankey diagram shows embodied carbon in food and agricultural products and the overall carbon footprint caused by the demand of food in Norwegian households, and consequently along the supply chains in agriculture/fisheries sector. [Updated by phineas, May 06]

This is very similar to Jason Pearson’s Economy Maps for visualizing environmental impacts.
Energy Flow in Norway Municipality

ENOVA is a public enterprise owned by the Royal Norwegian Ministry of Petroleum and Energy. It advises the ministry in questions relating to energy efficiency and new renewable energy.

One of their services is the practical development of energy and climate plans (Kommunal energi- og klimaplanlegging) for Norwegian municipalities. On their website they present a sample Sankey diagram to visualize energy flows.

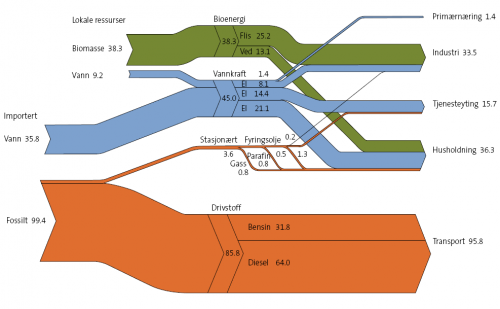
The Sankey diagram shows the energy flows in the Stor-Elvdal municipality in GWh (probably per year, a year is not given). This is very interesting, as the municipality can cover almost all of its energy for industry and private households from renewable energy sources, such as biomass and wind. Energy from fossil sources is consumed through almost entirely transportation. Stor-Elvdal produces 47.5 GWh within the municipality, and imports another 35,8 GWh from wind from outside the municipality.

A small typo can be found in label on the the orange flow (saying 85,8 where it should read 95,8), but this doesn’t spoil the overall quality of this diagram painted with SDraw, I guess.

Download the publication (in Norwegian) as PDF file