Tag: rare earth

EU Raw Material System Analysis

A study on key raw materials and their flows “through the EU economy, as raw materials or as parts of basic materials, components or products” has been produced by BIO Intelligence Service for the European Commission, DG GROW (BIO by Deloitte (2015) Study on Data for a Raw Material System Analysis: Roadmap and Test of the Fully Operational MSA for Raw Materials. Prepared for the European Commission, DG GROW).

It contains Sankey diagrams for 28 materials considered critical or important to European economy, such as cobalt, lithium, or tungsten.

The flows of these materials into the EU-28 geographical area (imports) as well as out of the EU-28 (exports) are displayed for all substances in the same way. Recycling of the substance within Europe is represented as a loop, leading to a kind of see-saw-ish diagram. Additions to in-use (e.g. the substance being part of a product in use) and a certain amount of the substance being disposed off (e.g. as waste) are also shown as arrows to the right. Below is the diagram for cobalt. Flows are in tonnes for the year 2012 (t/y).

All Sankey diagrams are color-coded the same-way, providing additional information whether the material (in the case above: cobalt) is imported as raw material or as part of a product, and whether it is exported as processed material, waste, or also as part of a product.

The study can be downloaded from this page or directly here (PDF, 6 MB)
Graedel REE wheel Sankey remake

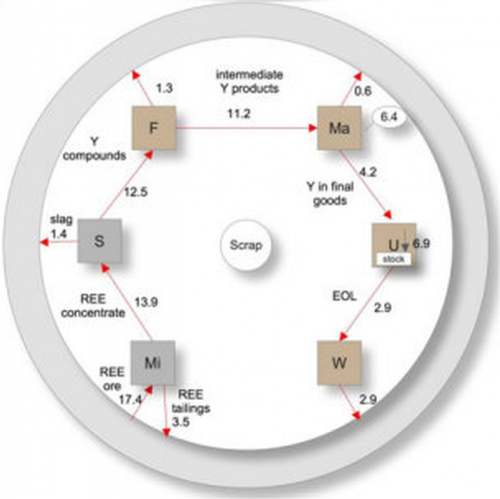
In this post on rare earths I have recently featured an alluvial diagram depicting rare earths use from a presentation by T.E.Graedel (Yale). That same presentation also lead me to another article by X. Du & T.E. Graedel titled ‘Uncovering the Global Life Cycles of the Rare Earths Elements’ (open access) that has a number of circular flow diagrams I would call “REE wheels”.

The article describes how quantitative data on rare earths is available for mining and processing, but “very little quantitative information is available concerning the subsequent life cycle stages”. Also, data is mostly available for the overall REE production, but not individually for every single rare earth element. They therefore aim to estimate and approximate the quantities for ten REEs, based on sources from China and Japan.

Here is the REE wheel for Yttrium (element Y) from the article:

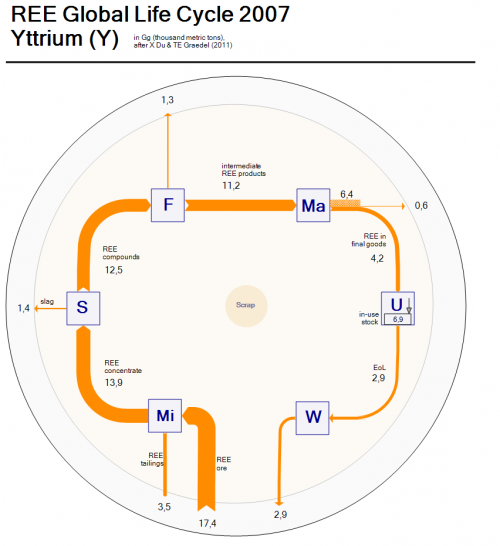
The diagram can be read from 7 o’clock to 5 o’clock in a clockwise direction. The processing steps are “Mi” (mining), “S” (separation), “F”(fabrication), “Ma” (manufacturing), “U” (use) and “W” (waste management), thus showing the flow of the rare earth element through the economic cycle.

I did a Sankey diagram version of the above Yttrium REE wheel to have the arrow magnitude representing the quantities. Flows are in Gigagrams (million metric tons) per year.

Due to the fact that the arrows connect horizontally and vertically to the node (and do not run diagonally like in the original) my remake looks less “circular” somehow… in fact it resembles more one of those retro indoor AM/FM loop antennas you would hook to your HiFi. So I am not fully satisfied with the outcome. Would it be better if the nodes were tilted 45°?

What’s nice is that the extraction of ore (17.4 Gg) can be directly compared to the 2.9 Gg Yttrium release to the environment. I switched ore input and tailings output at the mining node to have them side-by-side.

Comments and improvement suggestions welcomed.

Rare Earths Use, Alluvial Diagram

While brosing this presentation by Thomas E. Graedel, Yale University, Center for Industrial Ecology with the provocative title ‘Rare Earths and Other Scarce Metals: Technologically Vital but Usually Thrown Away’ I discovered the following distribution (aka alluvial) diagram. It was originally published in the article ‘Uncovering the end uses of the rare earth elements’ by X Du, TE Graedel in Science of the Total Environment, 2013 (pp. 781-784)

The diagram is best read from right-to-left: The right column shows ten rare earth elements (REE) and a node for the “other” five or seven REEs. Lanthanum (La), Cerium (Ce), and Neodymium (Nd) make up the largest portion mass-wise, followed by Praseodymium (Pr) and Yttrium (Y).

The middle column nodes (categories) represent technological uses of these REEs in e.g. magnets, automotive catalysts, or polishing powders.

The left column then represents the countries or regions where the components or products that contain REEs are produced: China, Japan, and the United States.

Data is for 2007. No mass unit or absolute numbers given for the diagram in this presentation, and I presently don’t have access to the original publication.

Du and Graedel have also published an interesting paper on ‘Uncovering the Global Life Cycles of the Rare Earths Elements’ where they analyse REE from mining to end-of-life with losses along the life cycle and display these data in a circular flow diagram for each REE. These “REE wheels” also call for a Sankey representation, but that will be for another time…