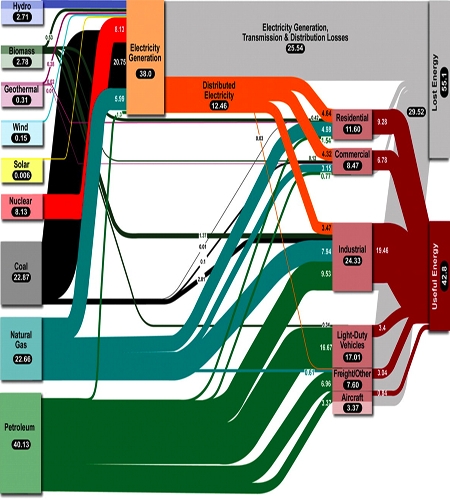
Joshua Rosenau over at scienceblogs took up on the energy topic in his ‘Thoughts from Kansas‘ and presents a Sankey diagram for the U.S. energy distribution (The Problem of Energy Generation) from an article in Science (Whitesides and Crabtree: Don’t Forget Long-Term Fundamental Research in Energy, Science 9 February 2007:Vol. 315. no. 5813, 796-798). It shows that more than 55% of the energy produced is lost, mainly in transmission and distribution on the grid (approx 25%) and another 30% in transport-related combustion of petrol [Note to self: do a Sankey diagram comparison for 1911 race car and modern light vehicle].
“…over half of the energy produced for our domestic market goes to waste. Fully two thirds of the energy produced by electrical generation and distribution goes to waste.”
This Sankey diagram shows the energy carriers on the left side, the sectors where energy is consumed (noteworthy: traffic has a larger share than industry) as midpoint groups, and a breakdown to useful and lost energy on the right.

