Tag: water

Water Cycle in the Netherlands by G Singh

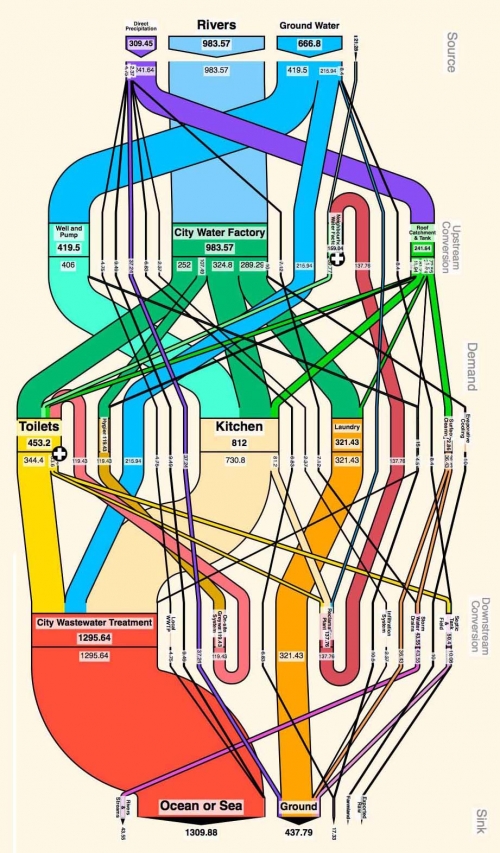
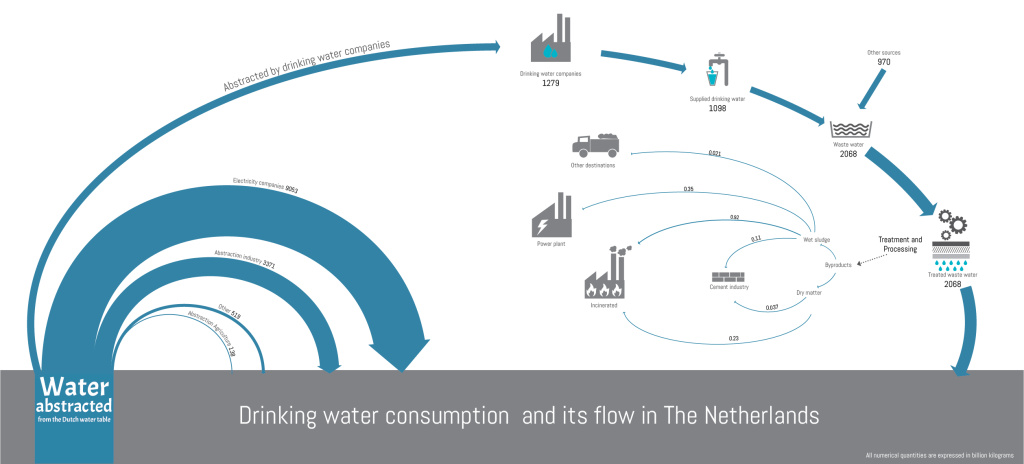
Just a quick post before the weekend: Visualization of the water cycle in the Netherlands by Gunjan Singh. See initial sketch and some comments here.


Quantities are in billion kg (=million tons). “The weight of the arrows depict the proportions most of the time”, exceptions are in the thin arrows at the right which would otherwise be fine hair lines only and almost invisible.

Fuel Cell Technology Sankey Diagram

As you are aware I am constantly looking for samples of Sankey diagrams, be they good, mediocre, or … fair.

This 2009 report on fuel cell technology (‘Natural Gas – Fueled Distributed Generation Solid Oxide Fuel Cell Systems. Projection of Performance and Cost of Electricity’ prepared by J.Thijssen LLC for US Department of Energy, National Energy Technology Laboratory, and RDS under contract number 41817M2846) has two Sankey diagrams I would like to share with you. The report assesses energy efficiency, water use and CO2 emissions of the fuel cell system.

I confess I am no expert in fuel cell technology (Wikipedia basics), and I assume the technology has evolved quite a bit over the last years. So I limit myself to a description of the Sankey diagrams presented.

On page 9 figure 3-4 shows the energy balance “Sankey Diagram of the Baseline NG DG SOFC System” (NG = natural gas, DG = distributed generation, SOFC = solid oxide fuel cell). With an energy content of the natural gas input of 9.1 MW (based on the higher heating value) and an output of 5.2 MW electric energy the system has an efficiency of 57%.
We can identify three loopbacks: syngas is recovered and fed back into the process, and heat is recovered “by thermal recuperation (by preheating the cathode air and raising and superheating steam) and chemical recuperation (by reforming part of the hydrocarbons, mainly methane, in the fuel)” (p. 8). These are the red arrows.
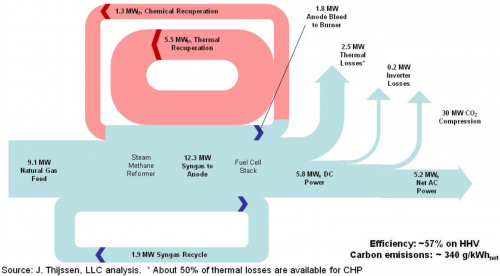
Now here is what I don’t like about the Sankey diagram: While most of the arrows seem to be to scale, some aren’t. Losses branching out to the top are graphically exaggerated. The arrow representing thermal losses (2.5 MW) should be about half as wide as the one for 5.2 MW ‘Net Power AC’.
The heavy spikes at the head of the arrow for inverter losses and energy used for CO2 compression overemphasize the comparatively small quantities of 0.2 MW and 0.3 MW (?!). The latter arrow seems to be labeled incorrectly (30 MW instead of 0.3 MW).

The Sankey diagram for water use of the fuel cell system on page 22 also has some obvious technical flaws:

In this diagram we are looking at water flow rates in kg/s. It seems as if most of the water is in a closed loop (0.52 kg/s) in the syngas recovery. The report on page 21 explains that “[w]hile the water demand for the NGDG system is considerable, net water use for the NGDG system is minor (only about 0.15 gal/kWh or 790 gal/day […]). The steam reformer has a steam demand more than 10 times this amount (about 0.55 kg/s)”. The label of the feed arrow at the top left has a wrong label and refers to 790 gal/hour(!).

The magnitude (width of arrow) of the main loop representing a flow rate of 0.52 kg/s water in syngas recycle is not maintained especially in the curves.
The main problem however is that it is not clear at which process step water comes in or flows out. I have come to the conclusion that the arrows for inflows (increase of arrow width) and outflows/losses (decrease of arrow width) are actually missing. So if you imagine an outward arrow to the label “0.12 kg/s water consumption at SMR” and two inward arrows from “0.44 kg/s water production in stack” and “0.06 kg/s water production in burner” the Sankey diagram starts to make sense.

Will try to draw my own version of the Sankey diagram and present it here. Note that ‘SMR’ is for steam methane reforming, abbreviation not explained in the report.
Water Use in Coal Power Plant

This presentation on ‘Water Management for Fossil Energy Systems’ by Susan M. Maley, Technology Manager for Crosscutting Research at the U.S. Department of Energy (DOE) / National Energy Technology Laboratory (NETL) gives an overview of the activities and research into ‘Current Activities in Water Management Research and Development’.

On page 9 it features these two Sankey digrams showing water usage in a 500 MW pulverized coal plant.

On the left the situation without CO2 capture, on the right with CO2 capture. Water withdrawal almost doubles (524 gal/MWh to 1049 gal/MWh) when implementing CO2 capture.

Mind that the left and the right Sankey diagram can not be compared directly as they use a different scaling factor.

DOE Energy Water Nexus

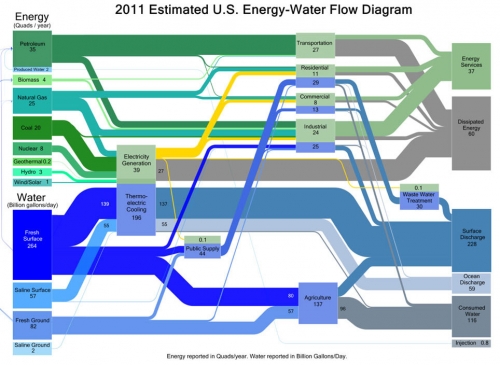
Via the EDF blog (no, not Electricité de France, but Environmental Defence Fund) comes this mixed Sankey diagram for energy and water flows in the U.S. in 2011.

Kate Zerrener explains in the post that energy generation and water consumption are deeply interwoven. The diagram shows which energy production and which consuming sector requires how much water.

“Water is measured in billions of gallons per day (BGD) and energy is measured in quadrillion British Thermal Units (Quads) per year. In the graphic above, water flows are represented in blue, energy in green.”

Ate your muesli this morning?

I have talked about a cereals Sankey diagram by INRIA Grenoble a couple of weeks ago in this post.

Here are two more Sankey diagrams from the underlying article ‘Etude des flux de céréales à l’echelle locale: Exemples en Rhône-Alpes, en Isère et dans le SCOT de Grenoble’ by J. Courtonne, J. Alapetite, P. Longaretti, D. Dupré.

These are the mass flows for cereals production in France (2007/2008) in Mt (1000 tons)

Here is the same cereals process chain “translated” into a water footprint. Unit is million cubic metres of water consumed.

A very clear structure in both diagrams with three columns: grains production, transformation and final products. Choice of color corresponds to the topic.

Participatory Urban Metabolism Information System

Interesting project described in the blog article ‘Understanding your city by understanding its flow: towards Participatory Urban Metabolism Information Systems’ by Sven Eberlein of the Ecocitizen Worldmap Project.

This is a participatory approach where young citizens track the water flows in their city in a crowd-mapping approach. The data is visualized as Sankey diagram (here called MetaFlow diagram). Pilots were carried out in Casablanca and Cairo.

This project is somehow linked to Sebastian Moffat’s activities I have featured in a blog post back in 2008.

This seems to be the result from either the Casablanca or the Cairo field work. Great colorful Sankey flow diagrams. Judging from the photos in the blog post, working with the local community seems to have been fun. The participatory approach is emphasized (Sven calls this a ‘Participatory Urban Metabolism Information System (PUMIS)’).

More Sankey diagrams can be seen in the original blog post.

Water and Energy Flows in Production

Dutch tech consulting firm ‘Water and Energy Solutions’ looks at optimization opportunities and cost saving potential in industrial production sites.

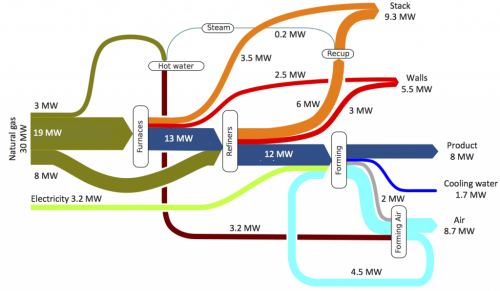
Their services offer is advertised with this sample Sankey diagram.

Their approach called “Flux Technology” is a methodology that “first considers a production site at the largest possible scope, focusing primarily on intersecting process and utility streams. At different scope levels we analyze site, plant(s), unit operations, equipment and general operations both qualitatively as well as quantitatively.”

Energy Embedded in Water

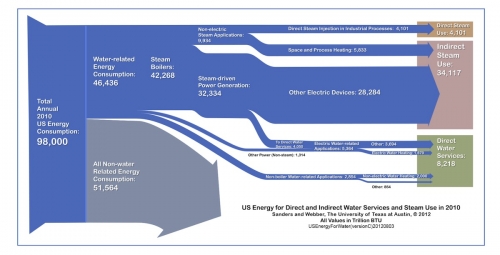
David Wogan at the Scientific American blogs that “Over 12 percent of all U.S. energy consumption is directly related to water”. This was identified in a 2012 study by researchers of UT Austin.

The values in this Sankey diagram are for 2010 in trillion BTU. Energy is used for direct and indirect water services such as steam generation.

The author argues “The study also identifies an interesting policy issue: roughly 25% more energy is used to heat, cool, or pump water than is used for lighting (in the residential and commercial sectors) in the United States – about 5 quads. So why are more efficiency policies and technologies targeted towards lighting and not water conservation?”