Tag: wood

Energy Flows in Wood Gas Process

From a presentation by Swiss company CTU Clean Technology Universe AG comes this Sankey diagram for energy flows in a wood gas process.

The diagram is set up for wood with 50% humidity and an energy content of 1 MJ. The process steps drying, gasification, methanation, CO2 removal yield gas with an energy content of 0,71 MJ (71%). Much of the offheat is recovered in the process, excess heat is fed to district heating.

Wood in brown, gas in orange, heat in red and electricity in blue.

Another Sankey diagram for wood gas here.

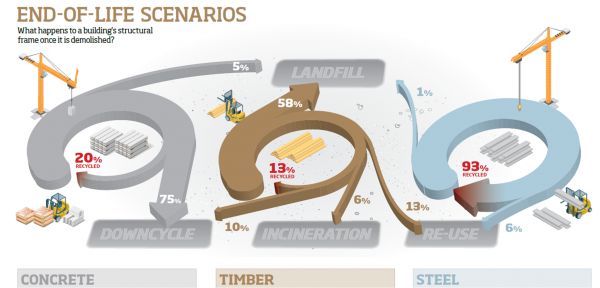
Recyclability of concrete, timber, steel

Nicely made infographic from steelconstruction.info wiki. What happens to the building materials on demolition, how much of concrete, timber and steel can be recycled?

The three arrows are curved and start at a 7-o’clock position. Used concrete from building demolition is mostly downcycled. Wood from structural frames is mostly landfilled, or re-used. Steel has a very good recyclability and most of the material can be recovered to make new steel.

The view angle and the images of construction machines make it a very attractive infographic.

Rosenheim wood gasifier more efficient

Interesting comparative Sankey diagram on page 16 of the 2012 environmental declaration of Rosenheim Stadtwerke (Rosenheim City Power?).

The city is building or already running a wood gasification plant. Instead of just using the heat from directly burning wood (with 30% energy loss), they decided to work with a wood gas carburetor and use the wood gas to run a gas motor. This is somewhat similar to CHP where heat and electric power can be produced. Overall loss of energy (“Verluste”) in the system is only 23%.

The green box at the bottom displays the avoided fossil GHG emissions per tonne of wood for both technologies.

Flows are in MWh, but only some selected arrows are labeled. Unfortunately the flows are not always to scale: yellow arrow “Wärme” (heat) in figure at top representing 3,15 MWh, but shown as half the width of the blue arrow 4,5 MWh. I reckon the diagram was build manually from rectangles and triangles.

Swiss Wood Flows

I received another diagram from Gabor Doka, who already pointed out the Swiss biomass flows Sankey diagrams to me. Gabor seems to have a close eye on publications in the environmental field in Switzerland, and he apparently is an avid follower of this blog. I appreciate.

He writes:

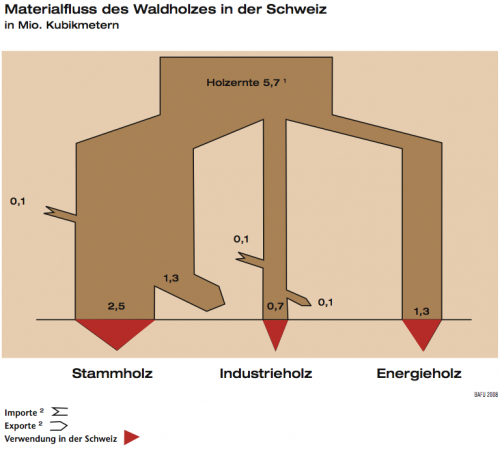
Now a very similar topic (just wood flows in Switzerland) but probably a by-the-book example of how not to do Sankey diagrams. This is from the FOEN magazine “Umwelt” issue 4/2008 (full PDF 8 MB here)

Shown are wood flows in Switzerland in million cubic metre. Again only in German though.

Errors that I saw include:
a) flows are slimming, when pointing in a non-vertical direction (“angle-dependent violation of mass conservation”). See e.g. “Stammholz Export” and “Energieholz” which both should be 1.3, but the latter is larger.
b) Addition of imports does not lead to wider flows. The author could not be bothered to deal with small flows, although 0.1 represents a 14 % increase over 0.7, i.e. perceptible.
c) The arrows representing “0.1” are over 2 times too wide, i.e. they visually represent 0.23. Also the arrow representing 0.7 is somewhat larger.

He continues:

What I do like is visual aid of identifying inland consumption (red arrows). Also inputs and outputs add up, which is always a nice thing 😉 However, this seems like a stitched together diagram drawn manually (and probably re-drawn for publication). This is supported by the angled design and observation that in the original paper publication, the main input representing 5.7 Mio m2 is exactly 5.7 cm wide…

Not much more to add from my side. Thanks, Gabor, for this contribution.
Energy Use in Particleboard Production

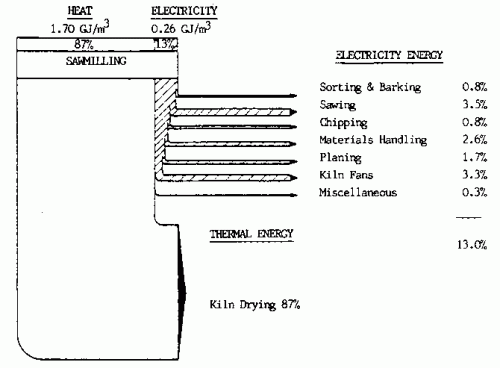
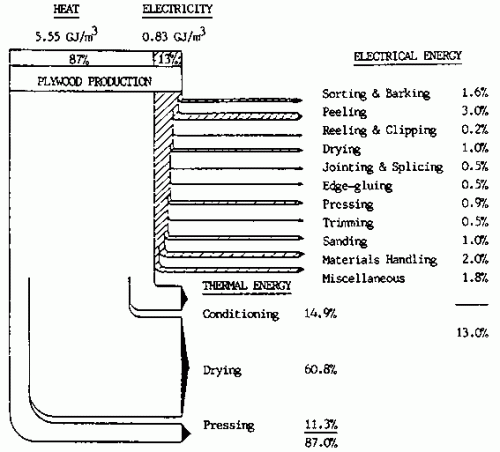
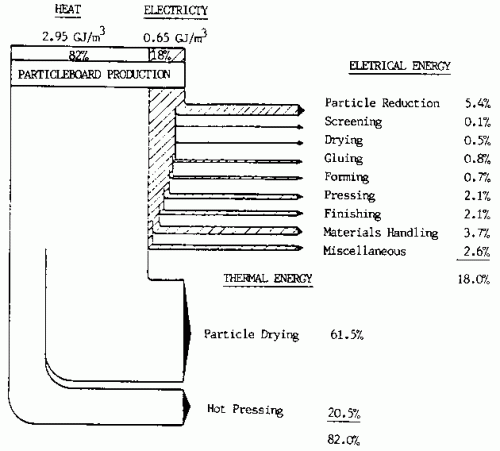
A reminiscence to the days when Sankey diagrams were drawn in black&white by hand and labeled with a typewriter. The three Sankey diagrams below from a 1990 article on “Energy conservation in the mechanical forest industries” by FAO (Food and Agriculture Organization of the United Nations, FAO Forestry Paper No. 93, Rome 1990) illustrates energy use in sawn timber, plywood and particleboard production.

Sawmilling:

Plywood:

Particleboard:

The article explains that

“Although the diagrams are of an approximate nature they do serve to identify the relationship that each major energy consuming centre has with each other and also readily identifies the prime energy users to which particular attention should be paid in any conservation effort.

In all three product manufacturing processes heating is by far the largest user of energy, representing some 82-87 percent of the total energy requirement in the manufacture of sawntimber, plywood and particleboard, with drying accounting for approximately 87 percent, 61 percent and 62 percent respectively.”

Use of Sankey diagrams with kind permission of FAO