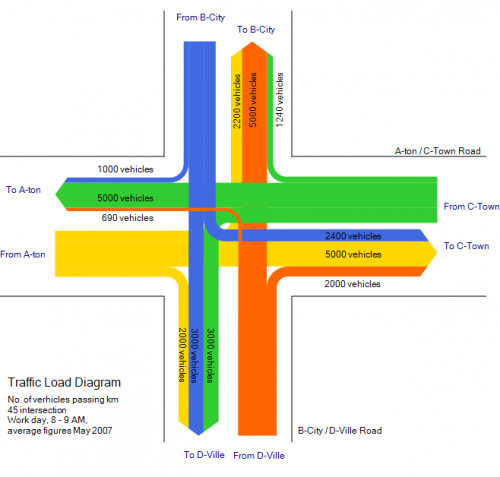
Just discovered this neat Sankey diagram provided in the e!Sankey 2.0 trial version as a sample file. It shows the number of vehicles passing a (virtual?) intersection within a given time frame.
Not sure if traffic planners could make use of such a visualization, but it is yet another nice idea of how Sankey diagrams (originally used only to visualize energy efficiency) are being used for other purposes.

1 Comment
Its not sure if traffic planners could make use of such a visualization, but it is yet another nice idea of how Sankey diagrams to be used.
Comments are closed.