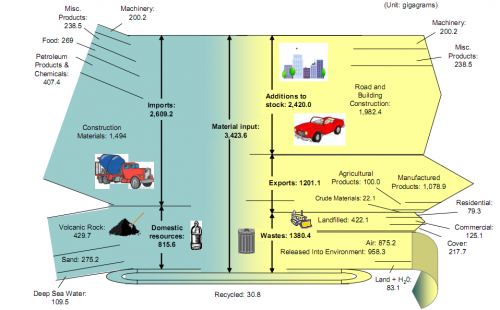
A group of graduate students form the Center of Industrial Ecology at Yale University in 2005/2006 researched the material flows on the “Big Island of Hawai’i”. Their research report (which can be found on the website of the Kohala Center) shows two Sankey diagrams, one of which is shown here.
Material Flow Accounting (MFA) “is the study of material flows on a national or regional scale. It is therefore sometimes also referred to as regional, national or economy-wide material flow analysis.” (Wikipedia). MFA is a research field in industrial ecology. As the authors of the report write,
Using an island as a unit of analysis is valuable both to the researcher and to those interested in the sustainability of the island itself. The researcher benefits from the island’s clear boundaries (most often defined by a surrounding water body) and a relative advantage in data collection provided by the fact that borders are monitored. Material flows are therefore relatively easier to understand on islands than in larger, more complex non‐island systems.
I have been posting about the use of Sankey diagrams in MFA before, and with few exceptions (Material Flow Sankey Diagram of Japan), have found that examples of Sankey diagrams for national MFA accounts typically are limited to selected bulk materials (e.g. biomass in Switzerland, gold flows in the U.S.).
Flows in the above Sankey diagram for the island of Hawai’i are in gigagrams (kilotonnes) and refer to the year 2005. Inputs are shown on the left side, and the fate of those inputs can be seen as exits to the right. More than 75% of the material flows are imported from off the island, the majority of these flows (57%) are construction materials. Consequently, road and building construction are the largest net addition to stocks with almost 2,000 kilotonnes.
The Sankey diagram has some minor flaws, regarding scale of the flows. Look for example to the division of the landfilled waste arrow (422 kt) into three almost equal portions, which are supposed to represent 79.3 kt, 125.1 kt and 217.7 kt. Also the width of the volcanic rock input flow (429.7 kt) is about four times the width of the machinery input flow (representing 200.2 kt). Still, I think it is a good Sankey diagram, and I wouldn’t mind joining the research group on their next visit to the islands…

2 Comments
This was a cool study i find this to be very interesting
Comments are closed.