Tag: New Zealand

New Zealand GHG Emissions Sankey

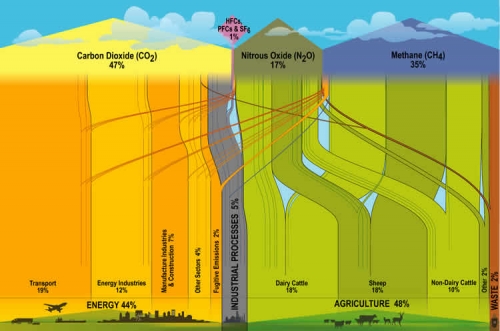
New Zealand’s Ministry for the Environment has the below Sankey Diagram on Greenhouse Gases (GHG) Emissions on their website.

It is interesting to compare this to the U.S. or to the world average. Similar GHG emissions diagrams have been published by the World Resources Institute WRI.

In NZ the main sources of emissions contributing to climate change are from agriculture (48%), while in the U.S. only 6.5% and on a world average this is only 13.2%. (Note: WRI data is for 2003, and there might be methodological differences in the background statistical data. But the proportions should be more or less correct).

Energy consumption accounts for more than 86% of the GHG Emissions in the U.S., and 44% in NZ. Quite a different panorama, and different challenges in New Zealand.

New Zealand Energy Flows 2007

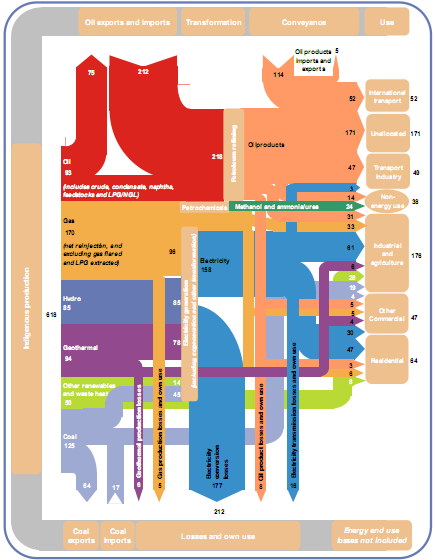
To compensate for the rather awkward Sankey diagram from NZ in my last post, here is a more colorful, and more recent one from Aotearoa. It shows the energy flows of New Zealand in 2007. The Ministry of Economy published a report “Energy in Brief”, which also contains this Sankey diagram:

The diagram shows the main flows in gross PJ (1 petajoule = 1015 J) and is “to approximate scale”. Flows below 2.5 PJ are neglected.

Energy produced domestically from various sources comes from the left, imports of coal and oil enter in the leftmost column from the bottom and the top. The energy flows pass through transformation and conveyance phases, to be finally shown in the different use sectors. Losses in transformation and conveyance are visualized with downward arrows, while losses in the end use are not considered.

There are some design flaws, especially when you look at the arrow curves. Also the fact that flows are only “to approximate scale” is in my opinion not acceptable [an arrow representing a flow of 3 PJ has the same width as one for 6 PJ, and both are only half the width of the 30 PJ flow]. But the overall impression is much better than in the version 10 years before.

Click here for a larger version of the diagram (PDF).

Confusankey Diagram

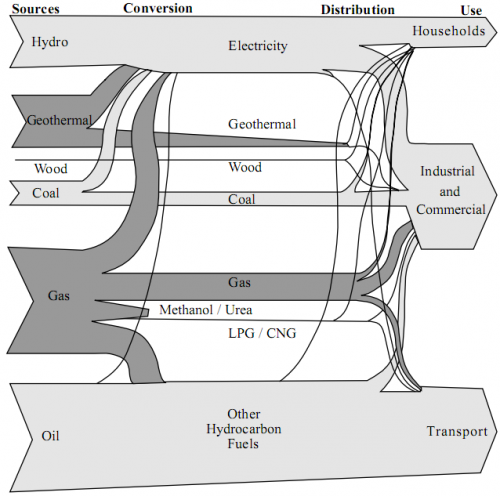
From the deepest and darkest parts of my bookmark list, here is a Sankey diagram for energy flows in New Zealand in 1997. I found it in a PDF document on this website of the Ministry of Economic Development (maori: Manatû Ôhanga).

The text under the diagram reads: “This energy flow diagram summarises New Zealand’s energy use. Primary energy sources are at the left. The flow of these through conversion processes to consumers is pictured, with final end-use classified by consumer type. The width of the bands is approximately to scale.”

Well, almost everything that can go wrong in information visualization goes wrong in this diagram… No quantities or units are given. Flows that are “approximately to scale” narrow down along the way. [The only explanation I have for this, is that this a novel way to account for transmission losses.] Streams meet, but don’t seem to merge. No idea what the spaghetti flows are good for…
In defense of the authors of this diagram I can say that in 1997 there probably weren’t any Sankey diagram software tools around.

I have a nicer one for NZ, which I will present in of my next blog posts. Better energy flow Sankey diagrams from other countries can be seen here, here or here.

What it takes to power a bulb

An article titled “Sustainable energy use and management” by Prof. Donald Cleland from Massey University in Palmerston North, New Zealand (published in: People and Energy: How do we use it? Proceedings of a conference organised by the Royal Society of New Zealand in Christchurch on 18 November 2004, p. 82-84, Wellington 2005) features three neat Sankey diagrams as an example for (un)sustainable energy use.

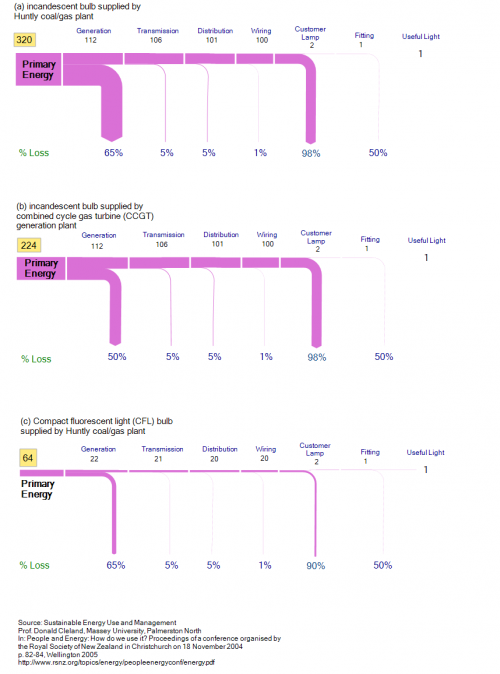
It is a comparison of how much energy is being used to power a lamp. The Sankey diagrams does not work with absolute values, but rather are scaled to one unit of “useful light”. You should read them “upstream” (from right to left) for better understanding. The first two diagrams (a and b) are regular incandescent bulbs. The third one (c) is a compact fluorescent light (CFL) bulb.

The bulb in the first scenario (a) is powered with energy from a coal/gas plant, which has an efficiency of only 35%. Further losses occur during transmission and distribution and at the bulb itself (98%).

In the second diagram (b) a combined cycle gas turbine (CCGT) power station provides the energy. It has a 50% efficiency.

The third one (c) uses energy from a common coal/gas plant again, but the customer uses a CFL bulb.

“A CFL is about 5 times more efficient so the losses reduce from 98% to 90%. In other words, a 20 W CFL produces about the same light as a 100 W incandescent bulb. Translated through the supply chain this means that the primary energy use is reduced to 64 units per unit of light, even if [a coal/gas plant] is still used. This is an 80% reduction in energy use. The benefit of a demand-side technology addressing the most inefficient part of the supply-chain is clear.”

Thus, the same amount of useful light can be produced at 64 units of energy in contrast to 320 units of energy.

Note: In the original publication the Sankey diagrams are not to scale to each other, so that the arrows for the primary energy values (320 units in the first, 224 units in the second, and 64 units in the third one) on the left all show the same magnitude. By bringing all three flow diagrams to the same scale, the significant difference between them becomes even more visible.