Tag: urban

From Sankey diagram to infographic

I really liked Will Stahl-Timmins’ article on how he developed an infographic on energy consumption in a city.

Will’s blog is called ‘Seeing is Believing’ and his central claim is that information graphics are “the visual transformation of data into understanding”. I agree: infographics are more than just a diagram and labels. They are much more “visual” and their design elements add to a better understanding. Diagrams convey data, infographics convey information. Typically they also have a broader audience: you would find a diagram in a scientific paper, but an infographic in a daily newspaper.

The article ‘Visualising city energy policies’ gives a very good insight into the reasoning of an infographer/designer when creating an infographic. Will describes how he started out from an ordinary Sankey diagram, to get to an infographic step-by-step. This involved studies of different alternatives, sketches on paper, discussions with colleagues, presentations, and many different versions of the infographic in Illustrator…

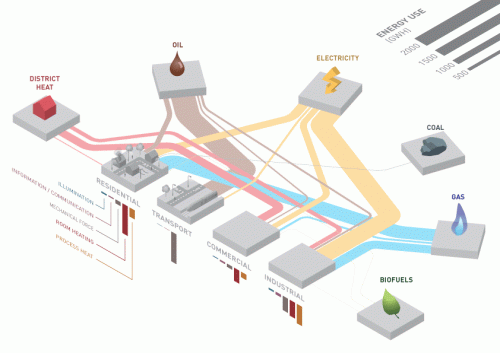
He experimented with an isometric or what he calls a “pseudo-3D” perspective, but also discovered some shortcomings in using them.

Crossing arrows were an issue. So were the stacked nodes (cubes) that hid parts of flows and were difficult to label.

The “intermediate” outcome of his meticulous work was the below infographic. It seemed to have been a long learning process to achieve this result.

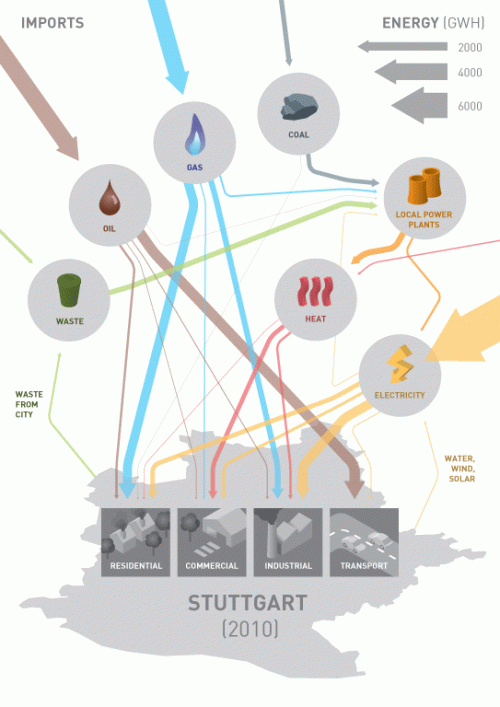
Will went on to include feedback he had gotten from fellow researchers, and decided to add more information on imported energy. At the same time he had to reduce the level of detail. This is the final infographic.

Good work, I think! The resulting infographic is not a genuine Sankey diagram anymore. There are only three arrow widths left, quantities are clustered in these groups. But as I said, an infographic has a different purpose.

It is not mentioned clearly how this infographic will finally be used, and who the target audience is. I imagine it will be used as an illustration in a brochure that summarizes the findings of the URGENCHE project, but to a wider, non-technical audience.

Make sure you read the full blog post at ‘Seeing is Believing’.

SOPA 2013 Award: Wiring the City

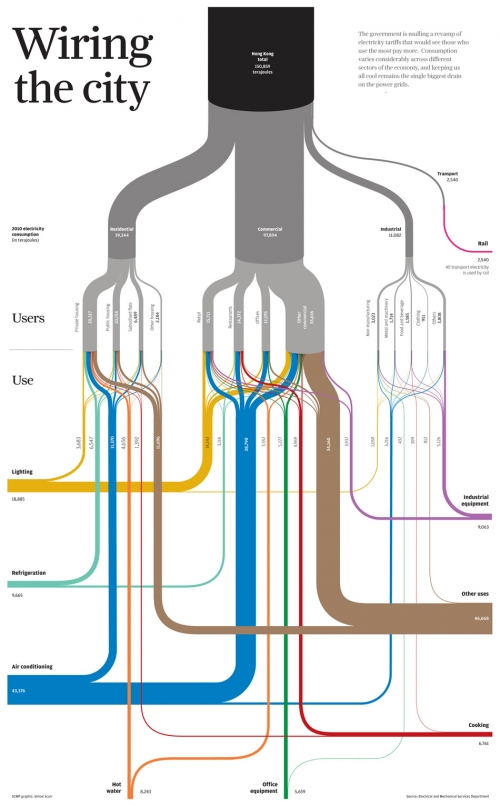
Simon Scarr has won a SOPA 2013 Award for Excellence in Information Graphics (PDF, see p. 13) with this Sankey diagram titled ‘Wiring the City’ originally created for the South China Morning post.

It shows energy flows and energy use in Hong Kong

On his blog he writes: “… we took a look at Hong Kong’s power consumption. Who uses all the electricity in our city and what is it used on? (…) Data set was provided by the government’s Electrical and Mechanical Services Department. (…) This type of chart is known as a Sankey diagram. The thickness of each line reflects a value. In this case, an amount of electricity in terajoules. All of the lines add up to give subtotals and totals by users (grey) and end use (coloured).”

Congratulations, Simon!

A day in the life of… Victor Hugo

I admire architects for their visionary ideas, for being able to transcend established limits, for pushing things beyond the common … at least when still in early phases of a project.

Victor Hugo Azevedo’s blog is called ‘La Ville Radieuse’ (The Radiant City) after a concept by Le Corbusier. It has all kinds of architectural stuff. By mere coincidence I discovered the following Sankey diagram he did in 2011 as class assignment on energy flows…

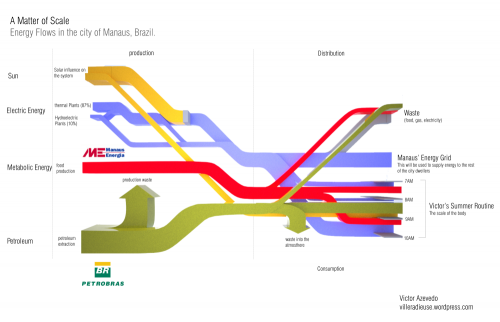
“This time we were asked to trace the energy flow that directly affect us. I traced the beginning of a common day during my summer in the city of Manaus Brazil. The following diagram shows how the larger infrastructure shape my routine.”

This looks at first sight like one of the classic ‘national energy flow’ Sankey diagrams with fuels (production) on the left, distribution and consumption on the right. But this is only partly true. Look at the right part where the energy flows stack and have a vertical time line.

“The next diagram is nothing more than a closer look into one of the ends of the diagram, which is my own routine on a four hour span (from 7AM to 10AM on a regular weekday in June)”

So forget about scale and units here … this is a concept diagram! The Sankey diagram links an individual’s consumption patterns with the bigger picture, thus stressing everybody’s personal share and responsibility in energy consumption (and the possibility to take action). Kudos for this idea!

Apart from that it is of course a fancy 3D rendering, and I love the rotation and close-up of the morning routine. Make sure you post a comment directly at Victor’s post, if you like it as much as I do!

Note: Somewhat related, check out Molly Eagan’s ‘Where is Petroleum in our Daily Lives’ here.

New Energy City Issaquah

Have you ever heard of the city of Issaquah, WA? To be honest, I hadn’t heard of it until I read this post on the New Energy Cities blog.

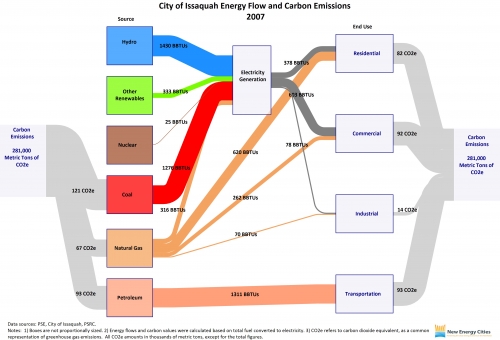
Issaquah is one of ‘New Energy Cities’ in the Northwest that has created an Energy Map and calculates the carbon emissions it is responsible for based on the fuels used. The role model for these Sankey diagrams are the ones published by the EIA.

Elizabeth, the author of the post, writes:

“Total carbon emissions are depicted in the gray flow lines, by both source and end use. The blue flow line represents hydropower energy used for electricity generation; the green represents non-hydropower renewable energy used for electricity generation; the brown represents nuclear energy used for electricity generation; and the red represents coal energy used for electricity generation. The orange flow lines represent natural gas used for electricity generation and direct heating. The pink flow line represents petroleum used for transportation. The dark gray flow lines represent electricity consumption by residential, commercial, and industrial user categories.”

Wow! I’ve seen those energy Sankey diagrams for the world, for nations and for federal states. But this one for Issaquah is definitely the one that covers the smallest geographical and administrative entity.

Energy Balance for Urumqi, China

Below is a Sankey diagram representing the energy balance for the city of Urumqi in Northwestern China. This was elaborated in a Sino-German Project on ‘Meeting the Resource Efficiency Challenge in a Climate Sensitive Dryland Megacity Environment: Urumqi as a Model City for Central Asia’ and has been published in the Integrated Heating and Building Energy Efficiency Master Plan for Urumqi in 2010

The Sankey diagram doesn’t sport the energy unit, but the text comment says:

The 2007 energy balance of Urumqi shows that about 541 PJ of primary energy was consumed in the city, accounting for 28% of the Xinjiang total (1,927 PJ). Urumqi used 25% of Xinjiang’s coal, 50% of its oil, 12% of its natural gas, and 4% of its renewable energy, much of it in heavy industry. This results in high energy related per-capita CO2 emissions of 22 tonnes. In 2007, the city consumed 14.7 million tonnes of coal (approximately 51% of its primary energy supply) whereby 30% of the coal consumption was used for the heating of buildings.

Madrid spendings in culture 2009

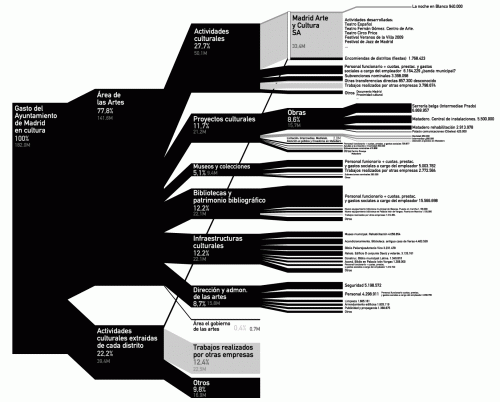
kulturometer.org presented a fantastic diagram that shows the municipality of Madrid’s spendings in cultural activities in 2009. By compiling data from numerous tables, tender calls, and administrative bulletins, they managed to stunningly visualize what one commenter called an ‘information overload’ (‘apagón informativo’). Click on the diagram to enlarge.

This is a breakdown diagram, or ‘diagrama de brazos’, that shows the distribution of the overall cultural budget (182 Mio Euros in 2009) by sectors, sub-sectors, and even into individual types of activities or projects.

It somewhat reminds me of Nicholas Rapp’s AIG bailout diagram, even though less colorful…

Each branch of the diagram is labeled with the relative weight in percent, as well as the absolute value in millions of Euros. The color scale indicates the reliability of the data, either non detailed estimate (light grey), published estimate (grey), or published budgeted data (black).

Here is the full diagram in large scale (PDF) with an additional breakdown of one particular section (Medialab) at another scale and full legend and annotations
Watch a slide show to learn more about the diagram (starting p 19)
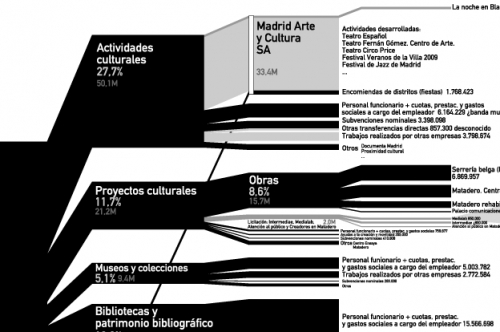
– And finally, a blowup detail of a diagram section:

Metropolitan Energy Flow Sankey Diagrams

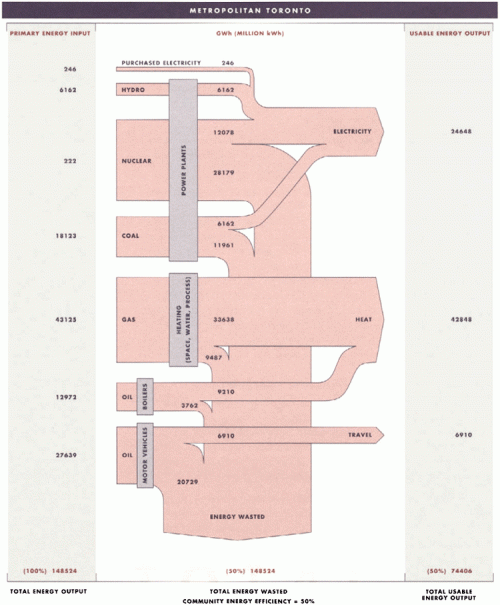
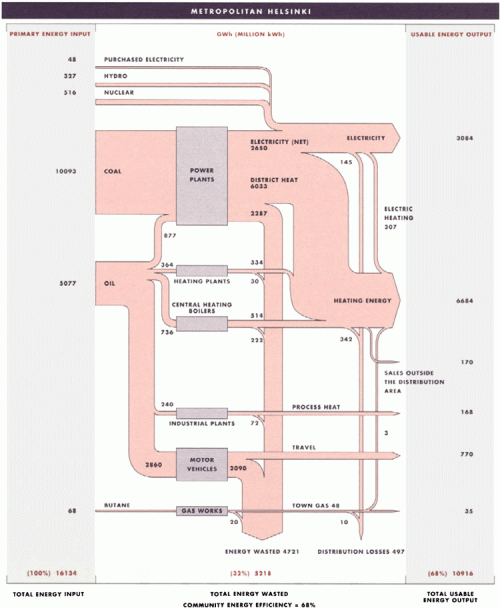
I have posted several Sankey diagrams depicting the energy flows of countries. At least California and West Virginia have published state energy flow Sankey diagrams. I was quite excited to discover the two metropolitan energy flow Sankey diagrams shown below in this publication. They are for Toronto and Helsinki and show energy flows in 1988 in these communities.

The two diagrams show energy consumption and use in Toronto (above) and Helsinki (below). Even though the absolute figures in GWh are given, one shouldn’t directly compare them. A per capita basis would be fairer (Toronto had a population of 2.5 mio in 2006, more than 5 mio. in the metro area, while Helsinki had 580.000 inhabitants in 2008 in the city, 1.3 mio in the greater Helsinki area — Toronto is today 4.5 times larger than Helsinki). Both are “cold-climate municipalities”.

The publication calculates a ‘community energy efficiency’ of 50% for Toronto and 68% for Helsinki. “A comparison of the two municipalities reveals that Helsinki significantly improved its efficiency by using the waste heat that is produced by local coal power plants to warm 90% of the buildings and homes in Helsinki. Further analysis has demonstrated that Helsinki’s energy system was able to achieve its overall level of 68% efficiency because the city’s compact land-use pattern made investments in energy-saving infrastructure, such as district heating and public transit, economically viable.”

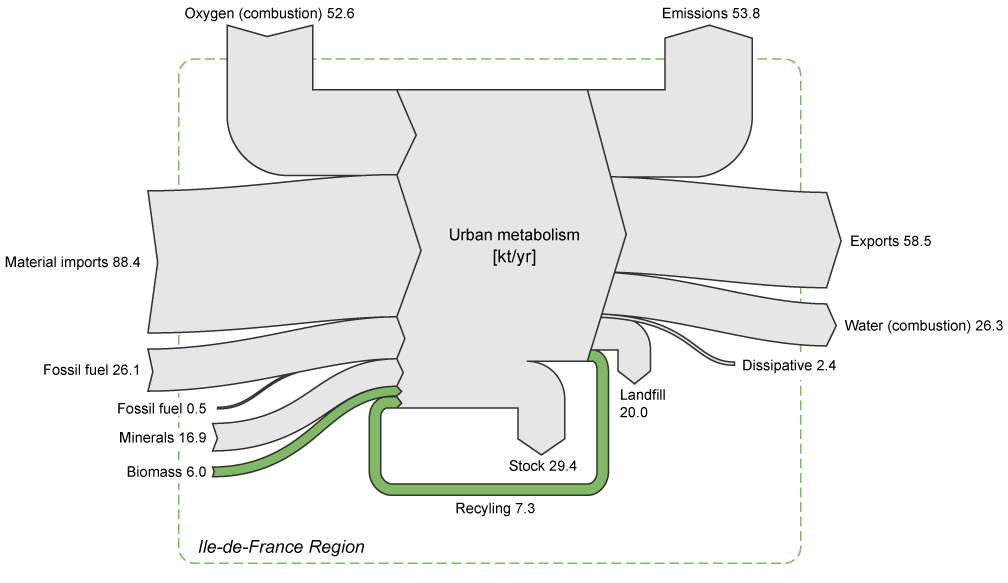
Does anybody know other metropolitan energy flow studies? I am aware of research activities in the field of urban material flow accounts or urban metabolism (e.g. Lisbon) but have to check whether they show Sankey diagrams in their publications.