This post on the Visual Think Map blog (new addition to my blogroll) guided me to the fantastic 1939 book ‘Graphic Presentation’ by Willard C. Brinton. It is available in full as a PDF on archive.org.
The book with more than 50 chapters features literally hundreds of graphics…
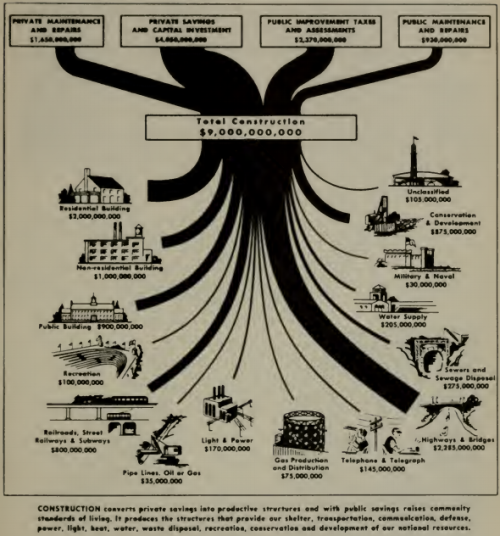
Chapter 8 (pp. 73 to 80) deals with “Flow Charts”, and has the above Sankey diagram on sources of funds and spendings in construction.
The chapter has an emphasis on ‘Cosmographs’ (a brand name at that time, apparently by IBM) and how they are made. I will dedicate one of the next blog posts to cosmographs I think. In the meantime, enjoy browsing Brinton’s book.
