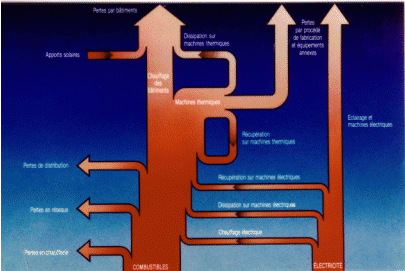
French La Courneuve based engineering consultancy B4E shows the following Sankey diagram on their energy diagnostics page.
Unfortunately the resolution is not good enough to determine any detail. I can understand as much as that they present fuels (“combustibles”) and electric energy (“electricité”) as the main energy sources. From these two sources the use of energy and losses (“pertes”) in a company is visualized in a bottom-to-top layout. No numbers are given, so this is just a schematic visualization.
As they say in the text: energy loss is synonym of ‘non-quality’
