Month: August 2007

Biomass dominates energy flows in Sri Lanka

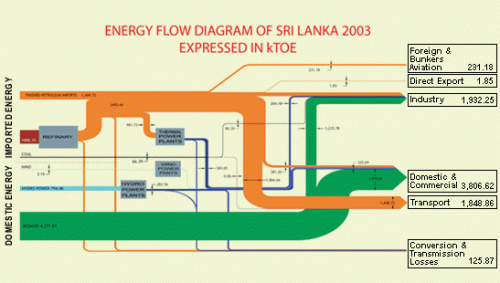
Do you know what country uses the top level domain “.lk”? Well, I didn’t know it either, until I came across this fine Sankey diagram of the energy flows of Sri Lanka on the website of the country’s Energy Conservation Fund. This island country (formerly known as Ceylon) has some 20 million inhabitants.

The flows in this Sankey diagram are in ‘kTOE’ (TOE = tons of oil equivalent). It shows that most of Sri Lanka’s energy in 2003 came from domestic biomass, the second largest domestic source is hydro power. Imported sources of energy are crude oil (refined in the -currently- sole Sri Lankan oil refinery), petroleum and a small portion of coal.

On the consumption side the largest energy using sector is domestic/commercial, followed by industry (using biomass generated energy as well) and transportation.

Transmission losses are relatively small compared to the situation in other countries. The energy flow picture of Sri Lanka thus is quite different to those I have previously presented here on this blog, such as for the U.S. or for Scotland.

What it takes to power a bulb

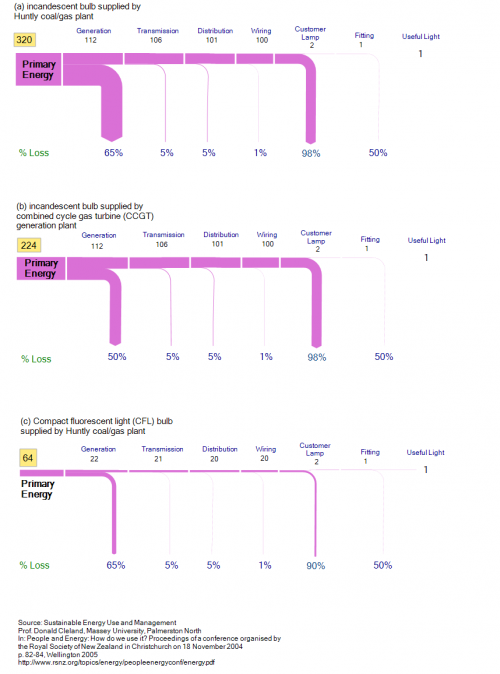
An article titled “Sustainable energy use and management” by Prof. Donald Cleland from Massey University in Palmerston North, New Zealand (published in: People and Energy: How do we use it? Proceedings of a conference organised by the Royal Society of New Zealand in Christchurch on 18 November 2004, p. 82-84, Wellington 2005) features three neat Sankey diagrams as an example for (un)sustainable energy use.

It is a comparison of how much energy is being used to power a lamp. The Sankey diagrams does not work with absolute values, but rather are scaled to one unit of “useful light”. You should read them “upstream” (from right to left) for better understanding. The first two diagrams (a and b) are regular incandescent bulbs. The third one (c) is a compact fluorescent light (CFL) bulb.

The bulb in the first scenario (a) is powered with energy from a coal/gas plant, which has an efficiency of only 35%. Further losses occur during transmission and distribution and at the bulb itself (98%).

In the second diagram (b) a combined cycle gas turbine (CCGT) power station provides the energy. It has a 50% efficiency.

The third one (c) uses energy from a common coal/gas plant again, but the customer uses a CFL bulb.

“A CFL is about 5 times more efficient so the losses reduce from 98% to 90%. In other words, a 20 W CFL produces about the same light as a 100 W incandescent bulb. Translated through the supply chain this means that the primary energy use is reduced to 64 units per unit of light, even if [a coal/gas plant] is still used. This is an 80% reduction in energy use. The benefit of a demand-side technology addressing the most inefficient part of the supply-chain is clear.”

Thus, the same amount of useful light can be produced at 64 units of energy in contrast to 320 units of energy.

Note: In the original publication the Sankey diagrams are not to scale to each other, so that the arrows for the primary energy values (320 units in the first, 224 units in the second, and 64 units in the third one) on the left all show the same magnitude. By bringing all three flow diagrams to the same scale, the significant difference between them becomes even more visible.
Heat Losses of a Family Home

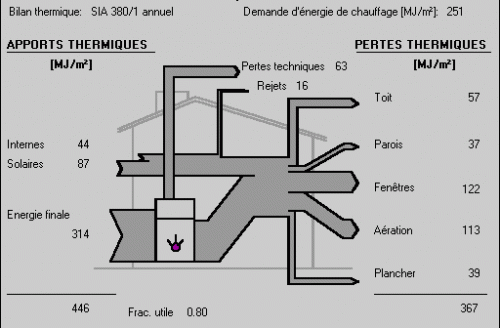
A few months ago I had found this b/w Sankey diagram on the website of the Institut de Génie Thermique (IGT) de la Haute Ecole d’Ingénierie et de Gestion du Canton de Vaud (HEIG-VD) in Switzerland, showing the energy or heat balance (bilan thermique) of an average family home.

It visualizes the sources of heat as Sankey flows into the building (in MJ per square metre) with the largest chunk being the combustible for the heating system, other inputs are from solar radiation and internal sources. On the right side it shows how and where heat is being lost: windows (fenétres) 122 MJ/m², ventilation (aéreation) 113 MJ/m² or roof (toit) 57 MJ/m². Also, the technical losses from the heating equipment (pertes techniques, shown as Sankey arrow from the heater to the top) are quite significant (57 MJ/m²).

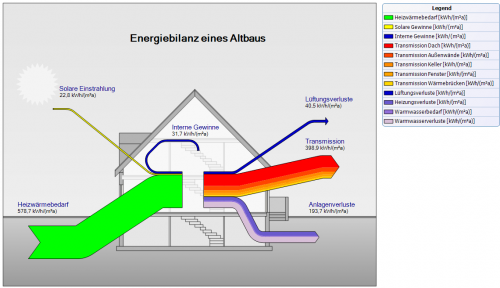
A similar Sankey diagram in German was presented on the e!Sankey forum recently.

This diagram submitted by one of their users is explained as follows:

In the diagram the group of flows in red colors are heat losses due to transmissions through walls, windows, doors, etc. The dark blue arrow shows heat loss through ventilation. The stacked purple/mauve flow represents heat losses at equipment and pipes.

While a little more detailed in the number of flows, it shows the same general situation: In many houses “a lot of the heat gets lost due to heat leaks (thermal bridges) or insufficient external insulation.”

All the world in one diagram

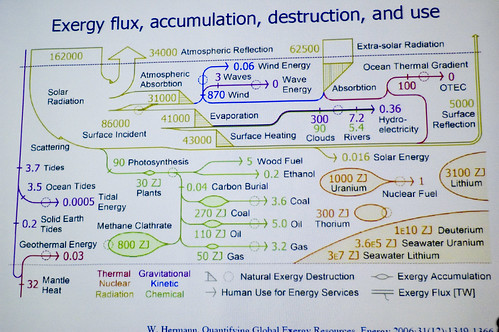
This post on the Pinhead’s Progress blog makes my day (if not my whole weekend!). ptuft draws the attention to a slide presented by Wes Hermann from Stanford at the SciFoo 2007 conference. You can see the original photo on flickr and the presentation slides “Earth’s Exergy Resources – Energy Quality, Flow, and Accumulation in the Natural World” by Wes Hermann here.

Slide from a presentation by Wes Herman (uploaded to flickr by zippy)

While I am not yet sure if this qualifies fully as a Sankey diagram, I find it really really fascinating! The diagram is titled “Exergy flux, accumulation, destruction, and use” and shows “where all the energy on the earth comes from, where it gets stored, and where it goes”. It distinguishes by colors the following exergy resources: Thermal, Nuclear, Radiation, Gravitational, Kinetic, Chemical.

The diagram type could be called a hybrid Sankey-Grassmann diagrams (see this post). The upper part is where radiation exergy is shown: 162000 TW of solar radiation and another 62500 TW of extra-solar radiation arriving on planet earth, being lost through atmospheric absorption, evaporation and surface heating. The green part (Chemical exergy) is what we focus on when we talk about energy consumption today. Hermann calls it “exergy destruction for energy services” (measured in ZJ). Accumulated exergy is shown with elliptic pouches on the arrow. Nuclear exergy features in the diagram as “bubbles”, most of it not accessible for human use as energy. One can find many other interesting details in this diagram.

I am tempted to challenge my e!Sankey tonight to see if I can draw this. Two different units (in this case TW and ZJ) can be displayed in one diagram. Biggest visualization issue will certainly be to handle the large differences in scale. Let’s see if I find the time, or if I prefer to enjoy radiation exergy of the summer sun at the poolside instead…

Using Sankey diagrams for visualizing web site performance

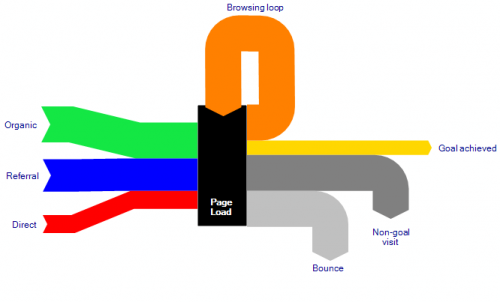
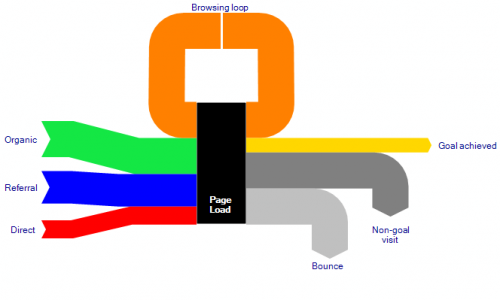
UK-based Stuart Brown at Modern Life in his latest post (“The Varying Virtues of Site Performance Metrics”) uses a Sankey diagram to visualize web site performance. This is a rather novel idea of using Sankey diagrams, but hey, why not?

This nicely done Sankey diagram – in this case without any absolute or relative numbers – shows where web site visitors come from (input flows from the left side), and if their visit can be considered successful (that is, meeting the “goal” of the site operator) or not as output flows to the right side. Returning visitors are shown with a “browsing loop” in the Sankey diagram.

I really like this Sankey diagram and I would love to see web site metrics being visualized in this way. It really is a good visualization and can show how a website performs, although Brown acknowledges that “there simply isn’t any single great method of gauging a site’s performance”.

Coming back to the Sankey diagram itself, it does however have a small flaw. Look at the grey arrows for “Bounce” and “Non-goal visit”. The latter does not connect to the “Page Load” node, but rather seems to dive under the “Bounce” flow and appears where this one branches of vertically.

I have created two alternative Sankey diagrams where these two flows set off from the “Page Load” box parallel (stacked), rather than in an overlay manner. The overall quantity represented by the flows on the output side should be equal to the number of visitors on the input side. The first diagram keeps the original idea of the browsing loop coming in from the top, the second one hooks it on the left side of the box.


Alternative version:

As for the colors of the two diagrams above, sorry Stuart, didn’t hit the right values right away…