Month: April 2010

Transport Sankey Diagram

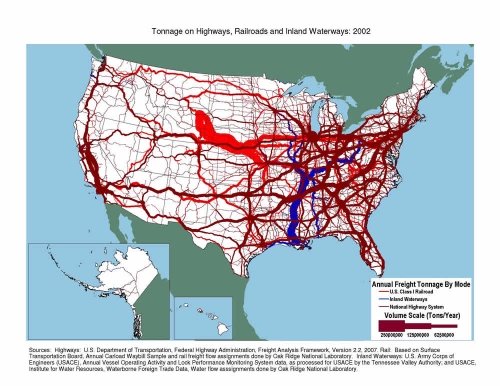
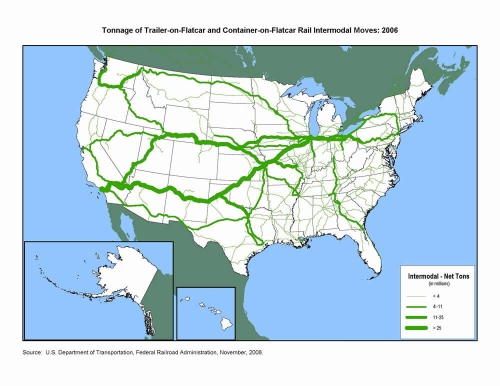
A reader of the blog pointed me to some Sankey diagrams available on the U.S. Department of Transport (DOT) Federal Highway Administration (FHWA) website. Sankey arrows are shown as a U.S. map overlay.


The first transport Sankey diagram shows the net tons of goods being transported on flatcars (either as trailer-on-flatcar, or container-on-flatcar) on the U.S. railway systems. The transport volume quantities are clustered into four groups shown with four different arrow widths. It is nice to see how in the eastern part you still have many railroad tracks, but with significantly less transport on them, while to the west coast you basically have 3 main lines, two of which carry more than 25 mio tons of freight per year.

The second one represents freight transport on railroad (bright red), inland waterways (blue) and national highways (dark red). Values also in million tons per year. I am not sure whether flows are to scale, or if transport quantities are also clustered into groups as in the first diagram. I can distinguish at least five different arrow magnitudes, even though only three sizes are given in the legend. A great transport Sankey diagram, as it shows that the East has most of the cargo, and has a much denser transport infrastructure. The reason why railroad transport on this second Sankey diagram differs so much from what is shown the first one, is probably due to the transport of bulk materials not shown in the intermodal transport quantity map.

Flows are not directional in both diagrams, so I assume that quantities for both directions have simply been added.

Can anybody confirm that the massive stream out of Wyoming by rail is coal?
SankeyTurtle

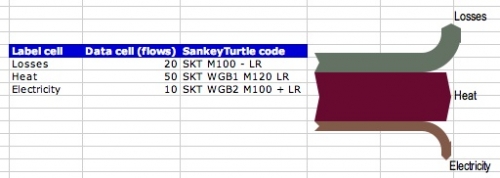
Gabor Doka, developer of SankeyHelper is currently working on SankeyTurtle, the implementation of a simple language for arrow routing in his Excel macro-based diagramming tool SankeyHelper. SankeyTurtle is currently being beta-tested.

The idea of SankeyTurtle code is to give each Sankey flux – each data cell – an accompagnying instruction how to draw the flux exactly in terms of path and geometry. The SankeyTurtle syntax is based on the vintage Logo TurtleGraphics drawing language, where you tell an imaginary turtle with a pen attached to it’s tail commands like “Move Forward” and “Turn Right 90°” and record the trail of the pen.

This will definitely an exciting improvement for all users of the SankeyHelper freeware … sorry, Sankeyware.

I’ll keep you posted about the progress and any official release.

More Austrian Energy Sankey

Kris commented on my last post, that there is an updated version of the Sankey diagram on energy flows in Austria in 2006 to be found in the Statistical Yearbook Austria 2009 on page 360 (page 6 in this PDF).

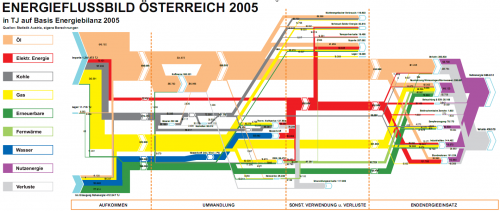
I also checked out some other Austrian sites and found one for Austrian Energy Flows 2005 (Energieflussbild Österreich 2005) on the Austrian Energy Agency website. It is a little more colorful, and has more information too.

Flows are in TJ. The diagram is divided into four sections, namely “Aufkommen” (emergence?), “Umwandlung” (transformation), “Sonst. Verwendung und Verluste” (other uses and losses), and “Endenergieeinsatz” (final energy use). The color code for the energy types is as follows: oil (pale orange), electric energy (red), coal (dark grey), gas (yellow), renewables (dark green), distance heating (light green), hydro (blue). On the right side useful energy is shown in purple, and losses are displayed as light grey arrows. (Thank you to my friend Leo for the translations…).

Yet another national energy flow Sankey diagram, and indeed a very beautiful one. Hope to see updates of it every year.

Energy Flow Austria 2002

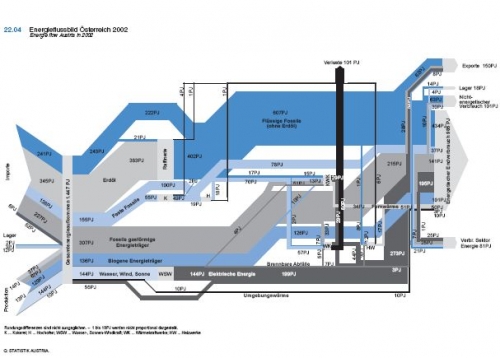
Found this Sankey diagram displaying the energy flows in Austria in 2002 on a web page with didactic material from that country.

Unfortunately this copy of the diagram isn’t very large, and I have trouble reading and translating everything. Flows are in petajoule (PJ), source given is Statistics Austria.

On the left are imports, withdrawl from stocks, and domestic production. Losses branch off in black to the top. The diagram differs fundamentally from the ones I have presented for other coutries (such as for New Zealand, the United Kingdom, or the U.S.) in two ways:
First, it doesn’t show the energy use by sectors, but instead a breakdown by energetic end use (985 PJ), non-energetic end use (101 PJ), exports (150 PJ), stock increase (18 PJ), as well as energy use within the energy sector itself (81 PJ).
Second, the colors of the flows are used to differentiate between liquid fossil (dark blue), gaseous fossil (medium grey) and solid fossils (light bluegrey) rather than specific energy carriers. Furthermore biogenic energy flows are shown in medium blue, renewables in very light blue. Converted electric energy is in dark grey.