Month: December 2014

Energy Flow in Open Rack Vaporiser

The scientific paper ‘A Sankey Framework for Energy and Exergy Flows’ by Kamalakannan Soundararajan, Hiang Kwee Ho, Bin Su (Energy Studies Institute, National University of Singapore) features these two Sankey diagrams.

Energy flow in an open rack vaporiser (ORV):


Exergy flow in an open rack vaporiser (ORV):

The authors explain that “ORVs regasify liquefied natural gas (LNG) from temperatures below -160°C to room temperature through a heat exchange process with sea water at room temperature and pressure. (…) The Sankey representation of energy and exergy flows here presents a large potential for energy savings that could be realised in the regasification process.”
Integration of Sankey diagrams, e!Sankey

Found out via the news feed from ifu Hamburg, maker of e!Sankey that they have released an SDK based on e!Sankey that allows software makers to integrate Sankey visualizations into their application.

Two main features help to achieve this: (1) building Sankey diagrams from an XML file that contains structural and layout information (2) feeding values into a Sankey diagram template by reading ID/value pairs from a CSV file.

Rytec: Analysis of Waste Incineration Plant

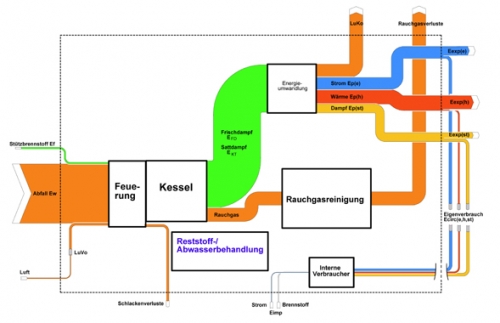
Consulting firm Rytec analyzes energy and heat utilization level of Swiss waste incineration plants and visualizes the processes using Sankey diagrams.

This Sankey diagram from their website is a simplified view and offers no details as to the actual figures. More detail can be found in this project summary (PDF).

Diagram labeled in German, but thanks to my friend Google Translate, I can identify ‘heating’, ‘boiler’, ‘energy conversion’ and ‘flue gas losses’. Orange streams to the top are losses.

Rosenheim wood gasifier more efficient

Interesting comparative Sankey diagram on page 16 of the 2012 environmental declaration of Rosenheim Stadtwerke (Rosenheim City Power?).

The city is building or already running a wood gasification plant. Instead of just using the heat from directly burning wood (with 30% energy loss), they decided to work with a wood gas carburetor and use the wood gas to run a gas motor. This is somewhat similar to CHP where heat and electric power can be produced. Overall loss of energy (“Verluste”) in the system is only 23%.

The green box at the bottom displays the avoided fossil GHG emissions per tonne of wood for both technologies.

Flows are in MWh, but only some selected arrows are labeled. Unfortunately the flows are not always to scale: yellow arrow “Wärme” (heat) in figure at top representing 3,15 MWh, but shown as half the width of the blue arrow 4,5 MWh. I reckon the diagram was build manually from rectangles and triangles.