Month: September 2015

Energy Efficiency in Food/Beverage Industry

In a presentation on “Low CO2 production in European food and beverage industry” the author Christoph Brunner from AEE – Institute for Sustainable Technologies (AEE INTEC) suggests process flow sheets and Sankey diagrams as tools used for energy efficiency analysis.

This Sankey diagram is used as an example for the creation of mass and energy balances and the visualization of the production process.

The diagram is from Austria and thefore in German. From translating some words I understand this is probably for a food/dairy industry. Flows are in MWh, but without a time span. Two steam generators (one run with natural gas, the other with petroleum) supply heat to different processes. The cooking chambers (“Kochkammern”) require most, followed by “Selch” (?) and heating of a “KSPW Tank”. Some heat is recovered from condensate.

Sankey diagrams can help understanding the energy flows of process systems and detect hotspots for optimization.

Misc Sankey Diagrams Uncommented 11

Still sitting on my hard disk are numerous Sankey diagrams I have yet to describe and post them here. The ‘Miscellaneous (Mostly) Uncommented’ series is a way to get them out to you.

A Sankey diagram from process engineering. This one is from a poster by Monika Szolucha from Warszwaw Polytechnic.

Google Translate tells me this is from a stationary membrane filter equipment that enriches methane content in biogas. Flows show throughput in kg per hour.

Minard’s 1858 Map of World Migration

Martin Grandjean digitized and vectorized Charles Joseph Minard’s World Map of Migration from 1862. His recent post reminds us that no too long ago migrants were also moving from Europe to other places of the world.

via martingrandjean.ch – full vectorized image 2 MB here

The map, based on data for the year 1858, “shows migration flows that contrast with the maps of the twenty-first century. That year, 86.000 Englishmen left their country, as 45.300 Germans, 20.000 French and 11.600 Portuguese.”

Read this interesting post from the Cartographia blog for additional detail on the map.

From a technical point of view, the only criticism I have of Minard’s map is that the direction of the arrows is not indicated. It requires the reader to know about origins or destinations of migration.

You can see the original Minard migration map (“Carte figurative et approximative représentant pour l’année 1858 les émigrants du globe, les pays dóu ils partent et ceux oú ils arrivent”) in this 2009 post and at Wiki Commons or directly at the Library of Congress.

You might want to check out another related June 2015 article by Martin Grandjean, where he points out some shortcomings of migration maps.

Graedel REE wheel Sankey remake

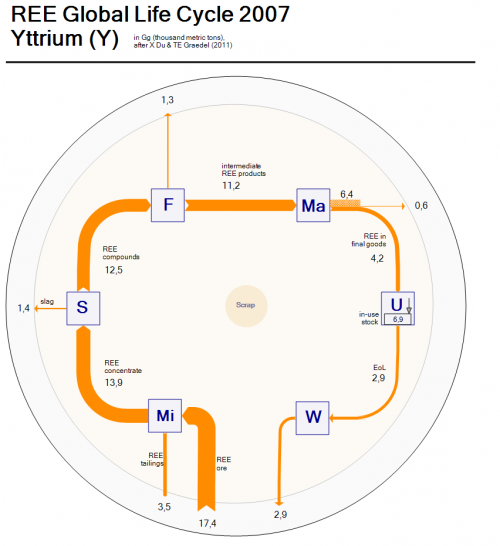
In this post on rare earths I have recently featured an alluvial diagram depicting rare earths use from a presentation by T.E.Graedel (Yale). That same presentation also lead me to another article by X. Du & T.E. Graedel titled ‘Uncovering the Global Life Cycles of the Rare Earths Elements’ (open access) that has a number of circular flow diagrams I would call “REE wheels”.

The article describes how quantitative data on rare earths is available for mining and processing, but “very little quantitative information is available concerning the subsequent life cycle stages”. Also, data is mostly available for the overall REE production, but not individually for every single rare earth element. They therefore aim to estimate and approximate the quantities for ten REEs, based on sources from China and Japan.

Here is the REE wheel for Yttrium (element Y) from the article:

The diagram can be read from 7 o’clock to 5 o’clock in a clockwise direction. The processing steps are “Mi” (mining), “S” (separation), “F”(fabrication), “Ma” (manufacturing), “U” (use) and “W” (waste management), thus showing the flow of the rare earth element through the economic cycle.

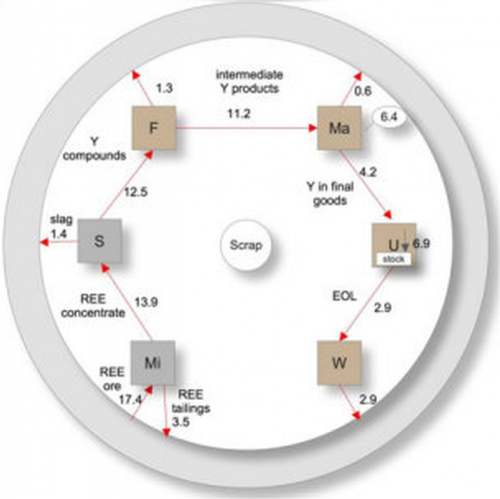
I did a Sankey diagram version of the above Yttrium REE wheel to have the arrow magnitude representing the quantities. Flows are in Gigagrams (million metric tons) per year.

Due to the fact that the arrows connect horizontally and vertically to the node (and do not run diagonally like in the original) my remake looks less “circular” somehow… in fact it resembles more one of those retro indoor AM/FM loop antennas you would hook to your HiFi. So I am not fully satisfied with the outcome. Would it be better if the nodes were tilted 45°?

What’s nice is that the extraction of ore (17.4 Gg) can be directly compared to the 2.9 Gg Yttrium release to the environment. I switched ore input and tailings output at the mining node to have them side-by-side.

Comments and improvement suggestions welcomed.
Visualizing Internal and External Heat Flow

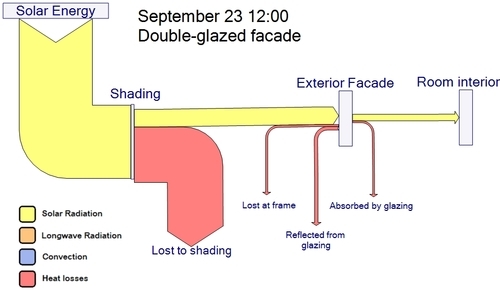
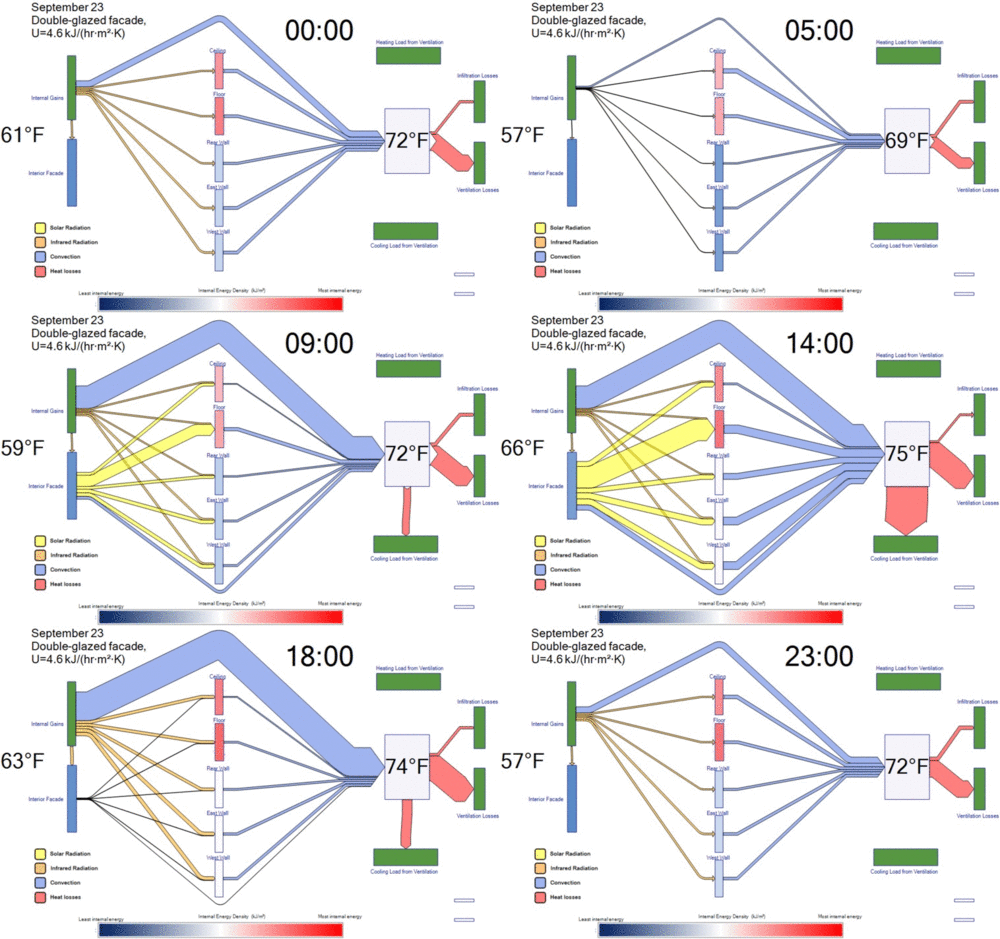
This post on the Transsolar ‘Green & Sexy’ blog features two Sankey diagrams. The “climate engineers” at Transsolar use them to model heat flows inside a building based on outside temperature and solar radiation.

No absolute values are given in these demo Sankey diagrams, but one can still get a general idea by observing proportions. Flows are color-coded with solor radiation in yellow, convection in blue, and heat losses in red.

The second Sankey diagram shown is a timeline made 24 frames – one per hour over a full-day. As the outside temperature rises and solar radiation increases around noon, the inside temperature and cooling demand increases.

(via tumblr)

Sankey diagram timeline by Transsolar

The authors explain:

“These Sankey diagrams allow us to see the proportion of how much energy is hitting the facade, how much energy is being radiated into the walls, how much energy is being convected into the air, and how much heating or cooling is actually needed to maintain an acceptable indoor air temperature. The animation is the first example we’ve ever seen of a Sankey diagram that represents the dynamic, ever-changing relationship of heat flows in a building with time.”