Month: October 2016

Switzerland Energy Flows 2015

This Sankey diagram for energy flows in Switzerland 2015 is by Max Blatter of energie-atlas.ch.

Flows are in TJ. The diagram has a consistent color coding: electricity in light blue, oil and derivates in orange, natural gas and biogas in yellow.

Sectors where energy is used are shown at the bottom right with private housholds, industry, services, traffic and agriculture.

Interesting to see that Switzerland’s electricity exports and imports were about equal size in 2015 (blue arrows to/from the top).

A 2007 energy flow Sankey diagram for Switzerland was presented in this post.
RenewIT Project: Green Data Centres

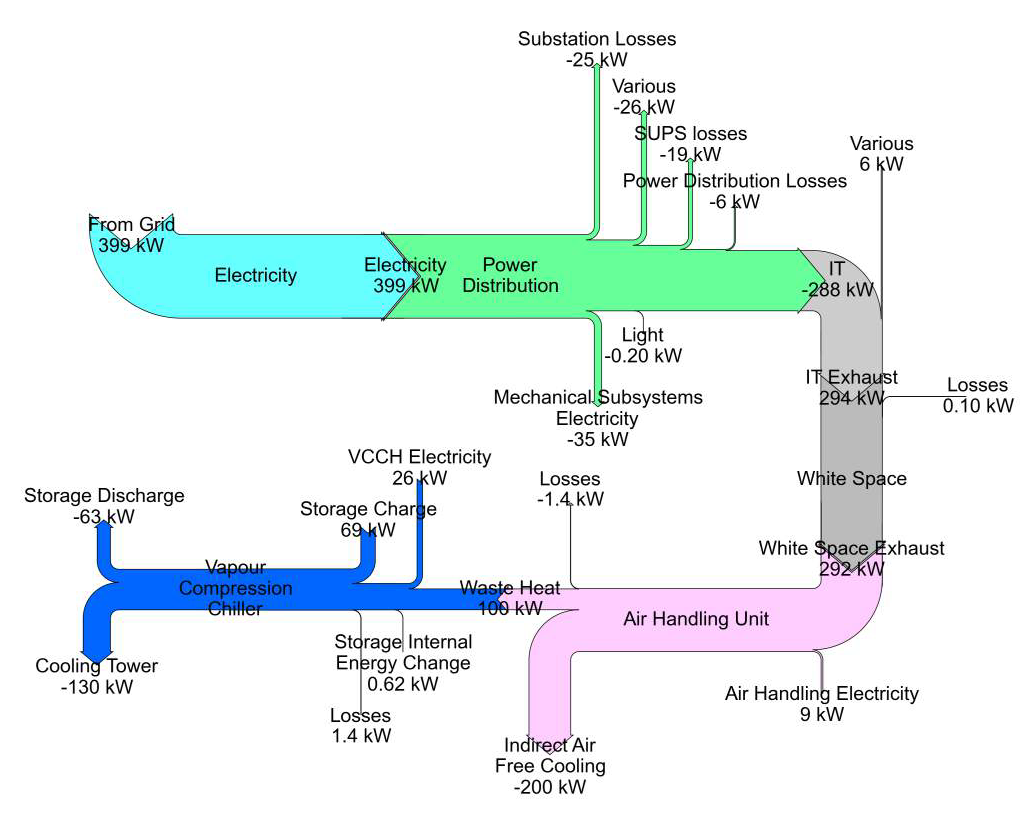
The European R&D project RenewIT studied energy concepts for renewable energy supply of data centres. The project partners from Spain, Italy, UK, Germany and The Netherlands looked at 18 different energy models.

In the final project report each of the concepts are described, accompanied by a Sankey diagram.

The above is figure 3.53 from p. 177 of the report showing the “Sankey chart for the distribution of average energy flows per year within different subsystems of concept 7 for scenario 3”.

Many more equally beautifully crafted Sankey diagrams can be found in the report, check chapter 3.5 Simulation Results of the publication Deliverable D4.5 Catalogue of advanced technical concepts for Net Zero Energy Data Centres. Authors: Nirendra Lal Shrestha, Noah Pflugradt, Thorsten Urbaneck (TUC); Angel Carrera (Aiguasol); Eduard Oró, Albert Garcia (IREC); Hans Trapman, Gilbert de Nijis, Joris van Dorp (DEERNS); Mario Macías (BSC) (get it here)

Zero Emission Coal System Sankey Diagram

From a July 2013 article titled ‘Energy and exergy analyses of a Zero emission coal system’ by Linbao Yan, Boshu He, Xiaohui Pei, and Chaojun Wang of Beijing Jiaotong University, available at Researchgate. This Sankey diagram is for “the exergy flow of the improved Z[ero] E[mission] C[oal] system at benchmark condition”.

Note: Image not available anymore

All flows are in kJ. The individual process steps if the system are only labeled with acronyms. They are explained in the article: GF is gasifier, CL is cleaner, RF is a reformer, and CH is a CO2 heater. The article also features the energy flow Sankey diagram.

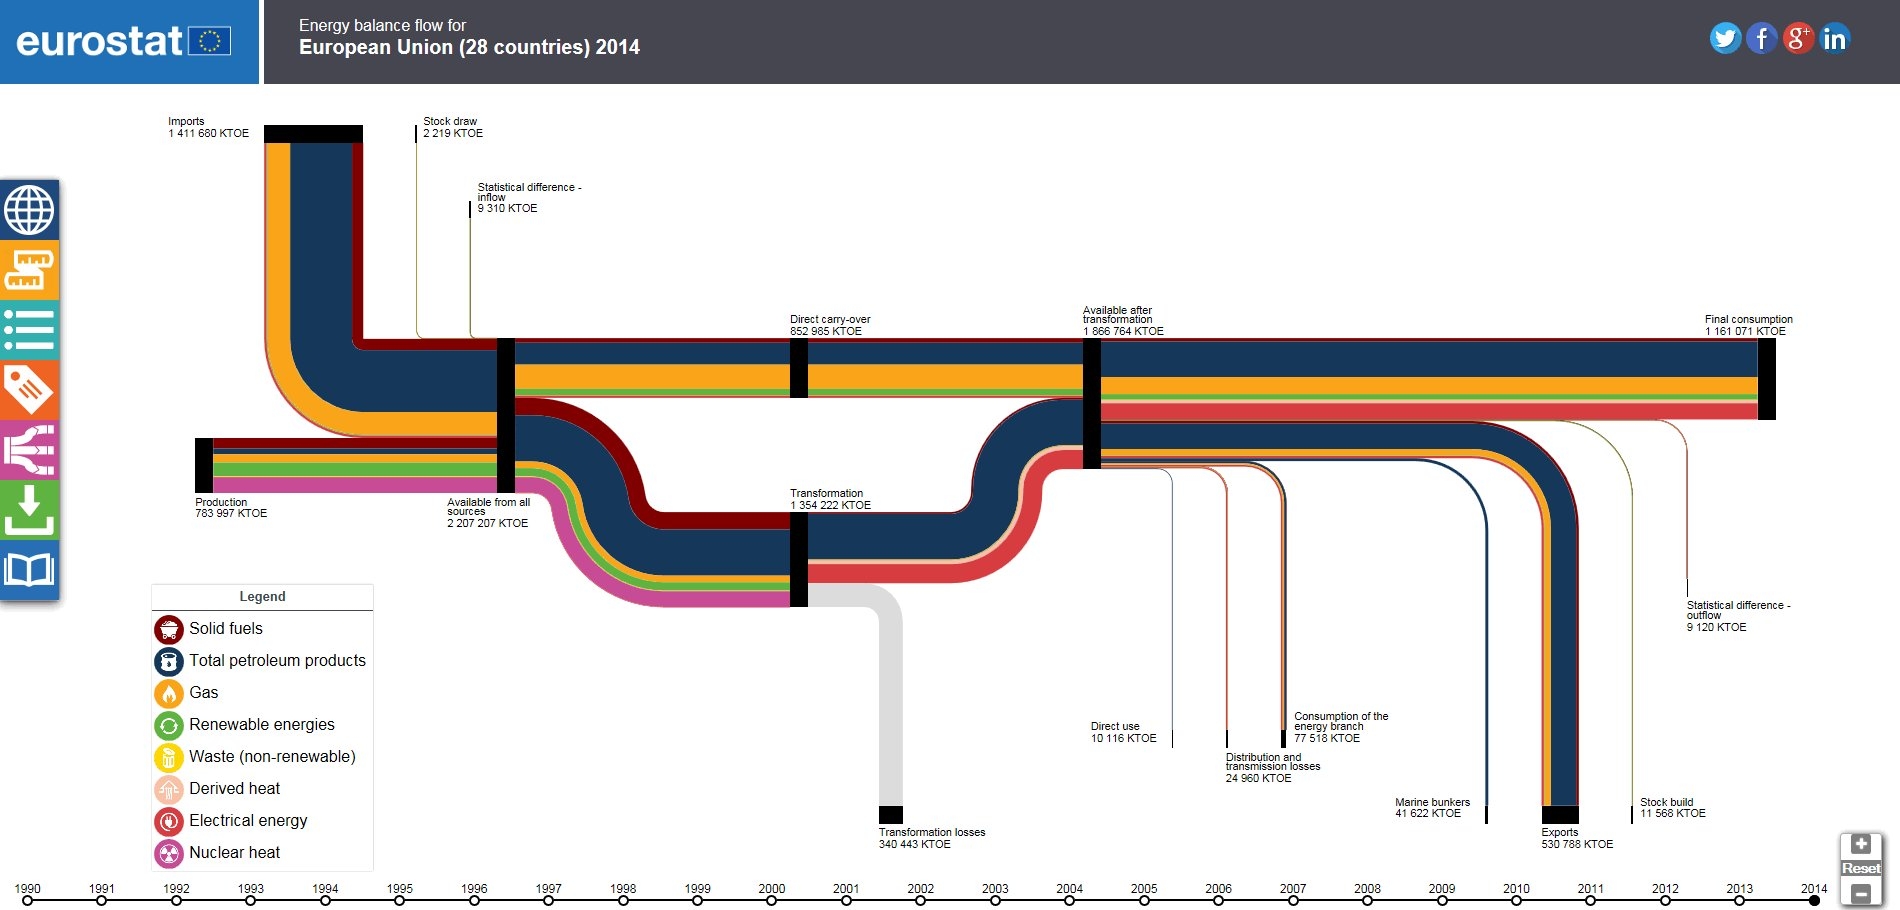
EUROSTAT Sankey Tool for EU-28

Interested in the energy flows of the Euopean countrues (EU-28)? Check out the Sankey diagram tool on the EUROSTAT webpage (the European Statistics Office).

You can choose to view the energy flows for individual countries, or the total for all EU-28. Switching between the data for the years 1990 up to 2014 lets you compare the changes over the last 25 years. The sidebar offers display options for the Sankey diagram.

Nice visualisation and much more fun to work with than statistics data in tables.