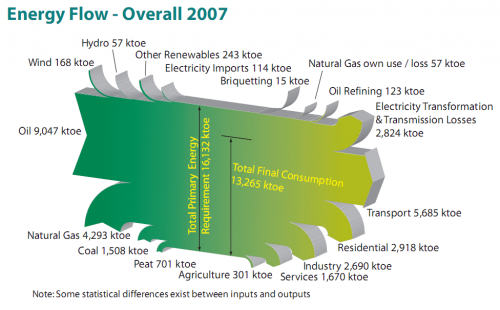
Colm from carbontracking.com in a comment to this blog post on Energy Flows in Ireland pointed me to an updated version of this Sankey diagram for 2007.
Sustainable Energy Ireland has published the report “Energy Ireland – Key Statistics 2008”.
This is the updated overall energy flow Sankey diagram from the report.
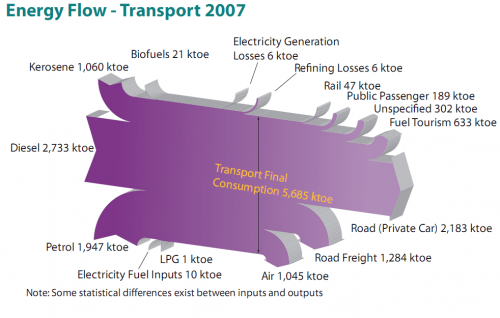
And here is another interesting one from the same report. It features the fuels used for transportation in Ireland with a breakdown by vehicle type.
All flows are in ktoe (1000 tonnes of oil equivalent, 1 ktoe = 41868 GJ). The flows seem to be mostly to scale, although there must be a problem with the flow ‘Refining Losses 6 ktoe’ which seems wider than the ‘Rail 47 ktoe’ flow, for example. Private cars consume most energy of all vehicle types (2184 out of 5685 ktoe or 38.4 %) , followed by trucks (road freight) and airplanes.
I won’t be commenting on the 3D design of the Sankey diagrams, which is definitely … eye-catching. Colm asked which software has been used to create these, but another reader had already pointed out in a comment that it is based on SankeyHelper, but has undergone retouching in Illustrator.

