After writing about VisioGuy’s radial Sankey diagram idea, I went through my bookmarks and collection of Sankey diagrams in search of further candidates for this special class of circular flow graphs.
Here are two goodies… 😉
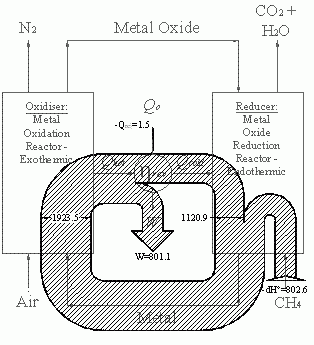
Below is a black/white Sankey diagram of energy fluxes in a chemical loop combustion cycle from an Imperial College website. It is similar to the radial one Chris designed, however it is not exactly circular. Not all of the entries and exits of the cycle are shown as Sankey arrows. The exit of the arrow labeled W is to the center (would one call this anticentrifugal?). The methane input makes a U-turn before entering the loop.
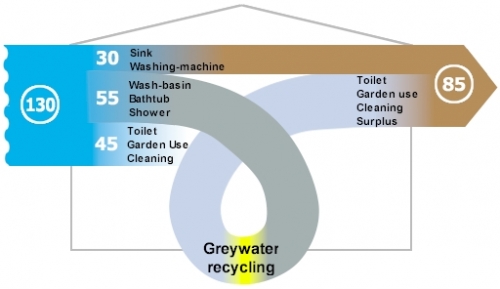
The other Sankey diagram is from this website of a U.K. based company, and shows greywater recycling. The average consumption of freshwater per person / per day in the UK was 130 litres in 1996.
The water from wash-basins, shower and bathtub could go through a recycling stage and be reused for flushing and watering the garden. The designer gave it a roller coaster style loop, which sure doesn’t add to the information content of the graphic, but immediately draws the reader’s attention to the recycling. I am not sure where the third flow coming from the right goes to. It represents the potential savings of 45 litres/day, but kind of disappears behind the loop.
I’ll post more of these as I come across them.

