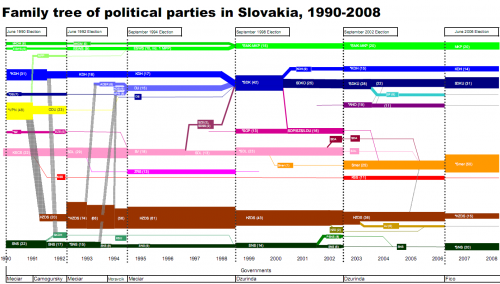
Kevin Deegan-Krause, an Associate Professor of Political Science at Wayne State University has contacted me with a fascinating idea and a unique example of a Sankey diagram. He writes: “I accidentally “reinvented” the Sankey wheel quite awhile ago for a rather odd usage: political party ebb and flow in E. Europe.”
This diagram he presented in a recent post on his Pozorblog shows how parliament seats were allocated to the different parties in the Slovakian parliament from 1990 to 2008, and how seats were shuffled during the six elections that took place during that time.
“As with energy, the number of party seats in parliament is a closed system and there are flows from some to others. This is a highly modified usage, of course, as we do not know in a precise way “where” votes go from one election to the next, so we just fudge at the day of election and just start over (or have invisible reallocations).”
Have a look, for example at the brown brown arrow: The HZDS party has clearly been on the loosing track. On the other hand SMER (shown in orange), a party that emerged as a spin-off from SDL (pink) in 2000, could gain a significant number of seats in the 2002 elections, when SDL couldn’t make it into Slovakian parliament any more. Others pretty much remained stable in their number of seats over the whole observation period.
I am not sure if Kevin uses the “official” colors of the parties (wouldn’t mind tossing my vote for the pink party 😉 ), but a color clustering would also allow to visualize if left, or right, or liberal, or whatever political direction gets stronger or weaker. It would also be a possibility to see, if there is an overall trend in a certain group of countries, such as Eastern Europe, or the apparent growth of socialism in South America.
I am calling for votes on how to name this special type of Sankey diagram. If the first Sankey diagram was for steam power, why not a power Sankey diagram? 😉

2 Comments
The layout of this chart reminds me of cross-functional flowcharts, otherwise known as “swimlane” diagrams.
The structure here is very similar. Left-to-right signifies the flow over time, while horizontal bands specify the parties.
My vote is for Swimlane Sankey Diagrams.
I hope “Swimlane” isn’t copyrighted 😉
– vg
Comments are closed.