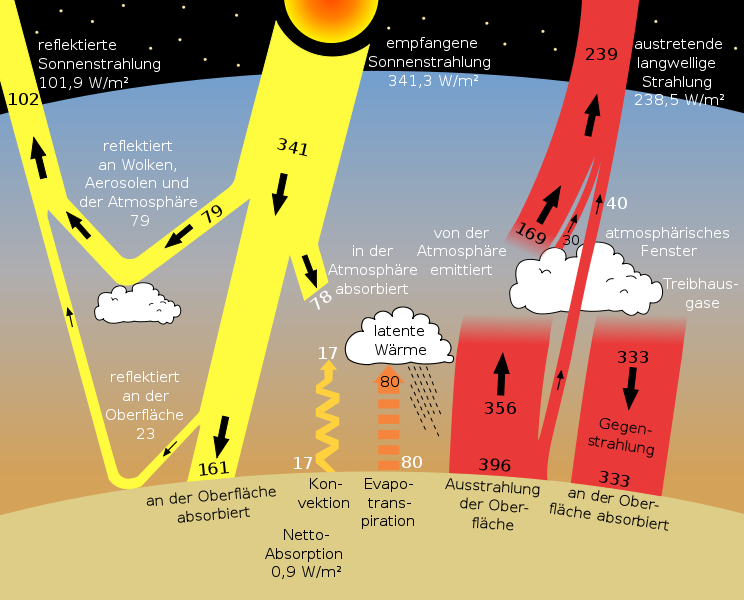
On Wiki Commons I discovered a different Sankey diagram image for the greenhouse effect than the one I presented in a previous post. The diagram is titled ‘sun climate system’, which seems appropriate.
The values are in Watt per square meters. Labels are in German, but if you want to know what they mean, just go to the original Earth Observer (Nov/Dec 2006 Vol. 18 Issue 6) PDF file by NASA and check out page 38.
