A research group headed by Andrew Skelton and Sören Lindner at Cambridge University’s Centre for Climate Change Mitigation Research is “developing environmentally extended input-output models to assess greenhouse gas reduction across production layers and supply chains of the global economy.”
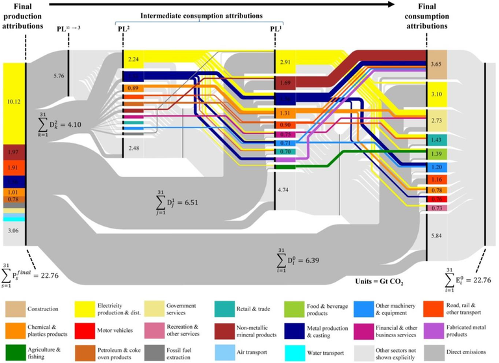
The figures on their webpage describing the group’s activities include this Sankey-style mapping of “flows of embodied emissions through the global economy [that] … help to visualise and explain … differences between production-based and consumption-based accounts of emissions”.
Unfortunately no high-res image is available. However, one can find the producing sectors on the left side (each of which identifiable by its own color) and their responsibility for a share of the 22.76 Gt direct CO2 emissions. On the right side one can see the consuming sectors and their use of input that has embodied emissions from the supply chain (two intermediate transformation steps in the centre).
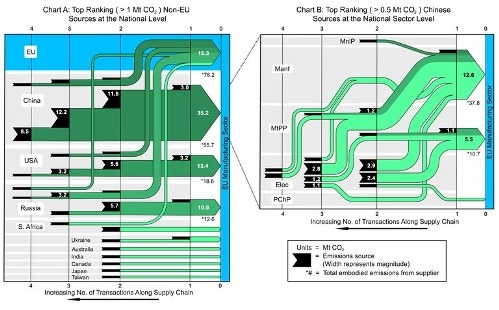
Additionally one can find these two diagrams for embodied emissions from supply chains. The left one is for all major non-EU sources, the right one a breakdown for products and intermediates sourced from China.
Data is based on input-output (IO) statistics and Life Cycle Assessment (LCA). An interesting topic and a good use of Sankey diagrams IMHO. Read more on the research web page that also has links to the scientific publication made by the group.

