While some were indulging in an extended spring cleaning (this year labeled ‘quarantine cleaning’) I decided to take on some of the hard disks sitting on my desk.
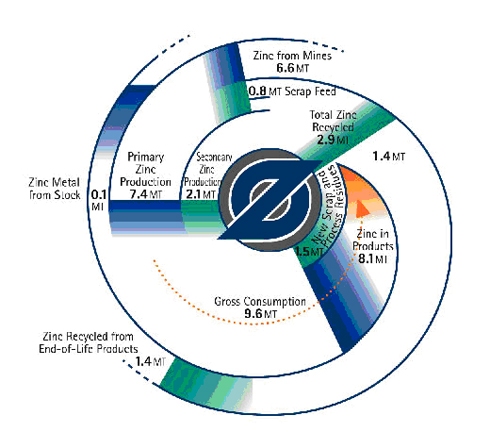
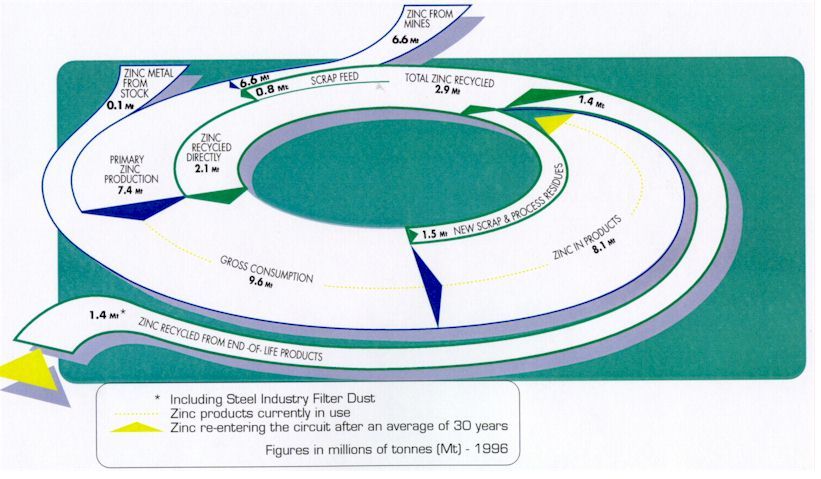
These circular zinc flow diagrams from 2011 survived the cleaning and are getting a new life here on the blog. They are more or less two versions of the same diagram, apparently with a Sankey diagram in mind.
The first is a top view and shows zinc flows in the economy (U.S. or world? … sorry, but I don’t have the accompanying text any more). Flows are in millions of tonnes (Mt) in 1996. The second one has the same numbers, but adds a 3D perspective…
Some tricky issues here: The ‘zinc in products’ stream of 8.1 Mt narrows down to zero, as the zinc sits in products, from where it later might be released into the cycle again. This does not help the attempt to draw them in a circle (to associate circularity of zinc flows). As a consequence the streams are not to scale (compare, for example the 0,8 Mt scrap feed flow right next to the 6,6 Mt flow for zinc from mines). The 3D perspective and the shadow effect don’t help in any way here…
Check out some more Sankey diagrams with the tag ‘circular’ and this post on radial Sankey diagrams.

