Sankey Diagrams

A Sankey diagram says more than 1000 pie charts

Menu
General

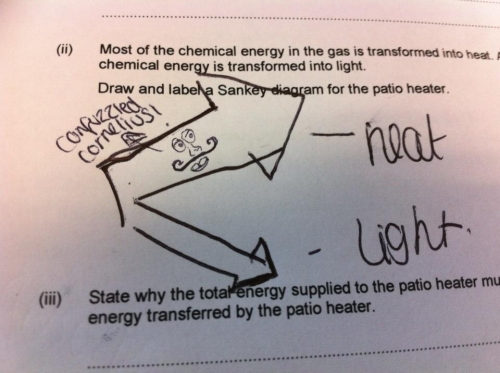
Confused Cornelius

phineasSeptember 24, 2014February 5, 2015

Found this photo somewhere on my hard disk. Probably stored it from Twitpic…
(edit: was a tweet by @Maariya28 on 22 Apr 2013)

This Sankey diagram is from a physics exam. Not sure whether Cornelius is the student or the teacher?!

School_Exam_Sankey

Promise to get back to serious by the next post.
Tagsfunschool
Previous StoryEnergy Flows Romania 2008
Next StoryNon Process Energy Flow Diagrams

phineas

Pages

  • About
  • Privacy Policy
  • Sankey Definitions
  • Sankey Diagram Software
  • Who is this Sankey guy?

Categories

  • Fakes
  • General
  • History
  • Methodology
  • Publications
  • Samples

Tag Cloud

AustriabiomassbuildingCanadacarChinacircularcogenerationcostefficiencyenergyenergy balanceenergy efficiencyenergy lossEuropeexergyfinancefoodFranceGermanyGHGheathouseLatin AmericamapmetalMFAmoneyNetherlandsprocess technologyremakesoftwareSpainSwitzerlandtradetransportU.S.UKurbanverticalvideowastewaterwoodworld

Blogroll

  • ChartPorn
  • Density Design
  • EagerEyes
  • Flowing Data
  • Infosthetics Blog
  • InfoVis:Wiki
  • Junkcharts
  • MFA Diagrams
  • Visual Complexity
  • Visual Literacy
Sankey Diagrams, Proudly powered by WordPress. Privacy Policy