Tag: 3D

Floating 3D Sankey diagram

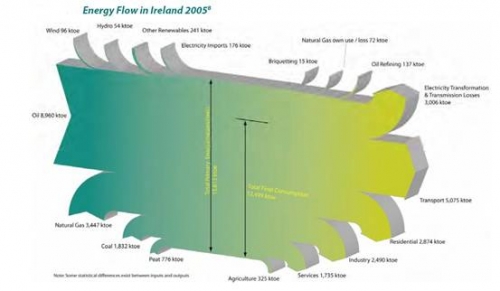
Another runner-up in my private “Fancy Sankey Diagram” contest definitely is this Sankey diagram shown on a webpage of the Longford Environmental Alliance (LEA) from Ireland.

It visualizes the “Energy Balance for 2005 as a flow diagram showing our inputs from the left hand side and our outputs or usages on the right hand side.” It is a 3-D image, and kind of floats above the ground, although it doesn’t have a fancy shadow effect as this one does.

I have shown similar diagrams for California, Japan, Sri Lanka, Scotland and the U.S. before. In these national energy balances the various energy sources are shown as entries from the left, while consuming sectors (or the “sinks”) are displayed as output arrows. This Irish Sankey diagram distinguishes ‘Agriculture’ as a separate sector.

Well done Éire, home of late Mr. Sankey…
3D Sankey Diagram from WBCSD

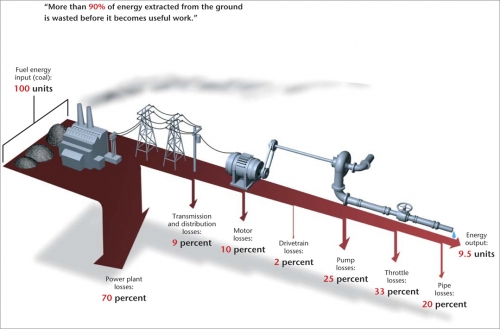
The World Business Council on Sustainable Development (WBCSD) in an article on “Making Tomorrow’s Building’s More Energy Efficient” features a great three-dimensional Sankey Diagram, to illustrate that “more than 90% of the energy extracted from the ground is wasted before it becomes useful work”. The article calls for green buildings where energy is produced onsite, and losses are minimized.

The Sankey arrows representing the losses bend down sharply, they remind me of the Iguazu Falls. Neat 3D images of the equipment are placed on the diagram to visualize the process steps where energy is lost. The whole thing hovers over the ground throwing a faint shade. The graphic designer who did this really merits an applause.

If ever I launch a ‘Best Sankey Diagram Award”, this one will have good chances to win it. Any sponsors out there? Any volunteers for the award jury?