Tag: GHG

Iran GHG Emissions from Energy Sector

Following up to my two previous posts on Iran’s Energy Flows and Iran’s Energy production and consumption, here is the third Sankey diagram I could find in the report ‘Iran and World Energy Facts and Figures, 2012’ published by Ministry of Energy (MOE) of the Islamic Republic of Iran.

It is on greenhouse gas (GHG) emissions caused by the energy sector in the country


This is interesting, as the setup is reversed in comparison to the typical energy flow diagrams we all know. Here, the consuming sectors are on the left, alongside the energy generation sector itself. The middle section of the diagram sorts the arrows by energy carrier that causes the GHG emissions: natural gas contributes 53% (orange) and petroleum products 45.6% (blue). The third column shows a breakdown into the gases CO2, CH4 and N20.

No absolute values are given in the diagram, the magnitude of the flow amount to 100%. However the detailed values can be found in the accompanying tables in the report: carbon dioxide with 556,866,000 tons, methane 57,000 tons and nitrous oxide 11,600 tons (all values for 2012). Mind that these are absolute values, so in order to understand the impact on climate change one would have to multiply with the respective emission factors for methane and laughing gas and normalize them to kg CO2-equivalents.
GHG Emissions of Energy from Biogas Plant

An article by Bachmaier, Hans; Effenberger, Mathias and Gronauer, Andreas in German agricultural technology publication ‘Landtechnik’ 65 (2010), no. 3, pp. 208-212 describes how “for ten agricultural biogas plants, a detailed balance of greenhouse gas emissions (GHG) and cumulated energy demand (CED) was calculated”.

Below is the Sankey diagram for plant E that has the “best GHG balance of all ten plants with net savings of 85 g CO2-eq per kWh el. Characteristics are a high share of poultry manure in the input saves energy for crop production; no additional mineral fertilizer needed; credit for surplus digested residue; high level of heat use.”

Biogas plant G has “Regular treatment of animal manure from own livestock; intermediate level of heat use; high methane emissions from CGU; high demand of fossil resources during plant operation (electricity supply from grid, fuel oil).”

Both diagrams feature the GHG emission burdens in CO2-eq per kWh electric energy produced from biogas. Upstream chains for fertilizer, diesel and electricity taken into account too. Displaced GHG emissions nonus in green. It is interesting to see that in this agricultural energy scenario methane (CH4) and nitrous oxide (N2O) are contributing to climate change in the same dimension as carbon dioxide.

Québec Energy Flows and CO2 Emissions

The CESAR (Canada Energy Systems Analysis Research) blog at www.cesarnet.ca had been idle for a while, but reopened 2015 with a post on Québec’s energy flows and related carbon dioxide emissions.

The post ‘The State of Energy in Quebec – 2015’ features two Sankey diagrams originally from a report in French language ‘État de l’énergie au Québec’ by HEC Montral (PDF here). Benjamin Israel is the author (should I say artist?) of these Sankey diagrams.

The first Sankey diagram is on Québec’s energy flows in 2012. Flows are in petajoule (PJ). 1 petajoule is described for everybody to understand as “(278 GWh) corresponding to the energy consumption of approximately 10.000 households in Québéc.”

Four columns give a structure to the diagram: energy sources, transformation, use, efficiency of the system. The upper part depicts energy produced in Quebec (“Énergie Produite en Québec”). Energy sources are purely renewable: hydro, wind and biomass. The bottom part shows fuel imports into the province: petroleum, natural gas, uranium, coal. Grey arrows collect the losses. Interesting to see how losses from energy generation and refineries in column 2 dive beneath crossing bands to rejoin the other losses in column 4.

The second Sankey diagram (from p. 27 in the HEC document) is a summary of greenhouse gas (GHG) emissions (in French: ‘émissions de gaz à effet de serre’ short: GES) in Québec in 2012.

Given the information from the above energy diagram, where Québec domestic energy production is 100% from renewable sources, it is not surprsing to see that the carbon emissions are mainly from imported energy. Combustion of fossil fuels makes up for 57 of the total 78 Mt CO2-equivalent emissions. The remaining 21 Mt of CO2-equivalent emissions are from industrial processes, agriculture and waste.

Québec’s per capita GHG emissions ranges lowest with 9,7 tonnes of CO2-eqs compared to other Canadian provinces (see scale in lower left).

Beautifully crafted Sankey diagram. I hope to see more on the CESAR blog in the future.

Landscape of Climate Finance

The ‘Landscape of Climate Finance’ is a project by the Climate Policy Initiative. CPI “works to improve the most important energy and land use policies around the world, with a particular focus on finance. (This) helps nations grow while addressing increasingly scarce resources and climate risk.”

At http://www.climatefinancelandscape.org/ the have put up graphically appealing and beautifully crafted slideshow with facts on climate finance. How much is spent? Where does the money go to? Who are the receiving countries. Please browse the slideshow here.

Below are two Sankey diagrams from the 2013 report on climate finance.

The first is a rather coarse overview showing the international funding of climate projects by OECD countries and Non-OECD countries. On the right side the recipients breakdown: within their own borders, OECD countries, Non-OECD countries. Details on the countries are available in the report. Flows are in billion US$.

The other Sankey diagram is more complex. Here we can see the sources of climate finance and intermediate agents, the instruments, the recipients and the uses (adaptation and mitigation).

The incoming flows from the left are mostly “not estimated” (NE) and therefore are not to scale with the outgoing arrows. There are many annotations on assumptions and constraints, so please don’t make conclusions directly from the image. In the online version one can hover over the nodes to receive more information.

Congratulations to CPI for this work. They are tackling a complex issue graphically, and make good use of Sankey diagrams for visualization.

CamU Climate Change Mitigation Research

A research group headed by Andrew Skelton and Sören Lindner at Cambridge University’s Centre for Climate Change Mitigation Research is “developing environmentally extended input-output models to assess greenhouse gas reduction across production layers and supply chains of the global economy.”

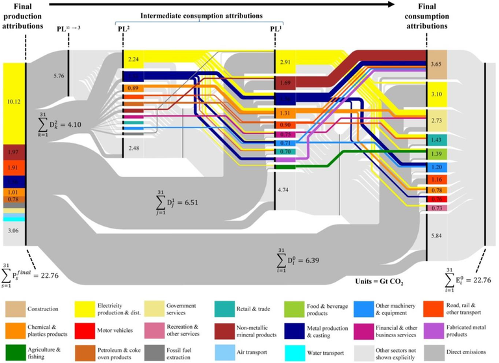
The figures on their webpage describing the group’s activities include this Sankey-style mapping of “flows of embodied emissions through the global economy [that] … help to visualise and explain … differences between production-based and consumption-based accounts of emissions”.

Unfortunately no high-res image is available. However, one can find the producing sectors on the left side (each of which identifiable by its own color) and their responsibility for a share of the 22.76 Gt direct CO2 emissions. On the right side one can see the consuming sectors and their use of input that has embodied emissions from the supply chain (two intermediate transformation steps in the centre).

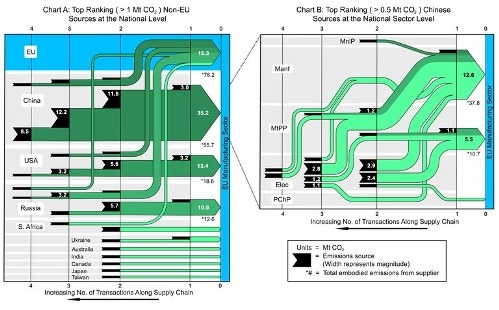
Additionally one can find these two diagrams for embodied emissions from supply chains. The left one is for all major non-EU sources, the right one a breakdown for products and intermediates sourced from China.

Data is based on input-output (IO) statistics and Life Cycle Assessment (LCA). An interesting topic and a good use of Sankey diagrams IMHO. Read more on the research web page that also has links to the scientific publication made by the group.

Energy Sankey for UCL Campus

The company with the catchy name ‘Useful Simple Projects‘ is “a design led consultancy [that works] with organisations and on major urban development projects to develop sustainability strategies, and identify opportunities for innovation”.

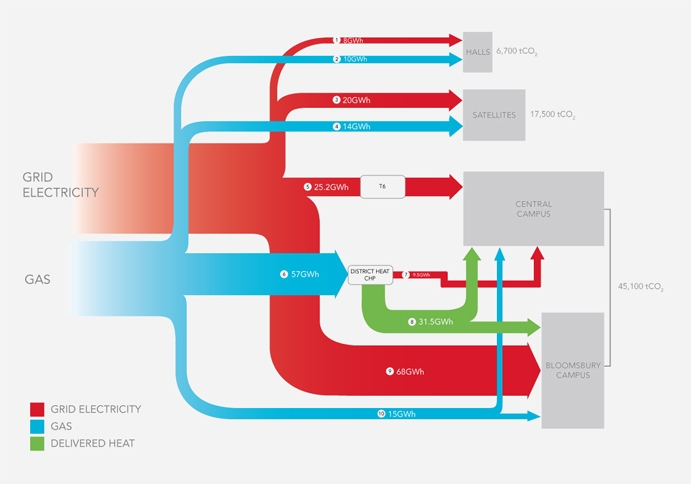
Here is a Sankey diagram they did for an energy strategy study for University College London’s Bloomsbury Campus.

Values are probably for a year. The Sankey diagram shows energy consumption in GW (red and blue arrows). The UCL campus has a cogeneration plant, so heat (green arrow) can be produced and distributed by district heating grid.

The numbers in grey show the carbon emissions in tons of CO2 linked to the energy consumption (most likely using characterization factors for electric energy production in the UK and for provision of natural gas). UCL has a low carbon strategy for the next years and this study helps them to review their goals.

This Sankey diagram is … simple and useful.

New Zealand GHG Emissions Sankey

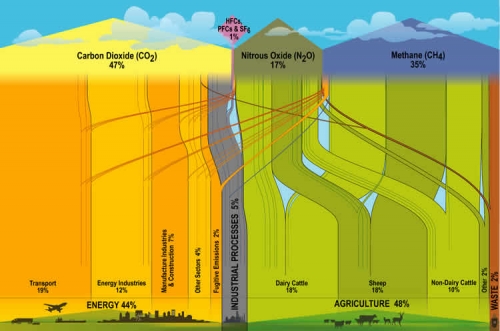
New Zealand’s Ministry for the Environment has the below Sankey Diagram on Greenhouse Gases (GHG) Emissions on their website.

It is interesting to compare this to the U.S. or to the world average. Similar GHG emissions diagrams have been published by the World Resources Institute WRI.

In NZ the main sources of emissions contributing to climate change are from agriculture (48%), while in the U.S. only 6.5% and on a world average this is only 13.2%. (Note: WRI data is for 2003, and there might be methodological differences in the background statistical data. But the proportions should be more or less correct).

Energy consumption accounts for more than 86% of the GHG Emissions in the U.S., and 44% in NZ. Quite a different panorama, and different challenges in New Zealand.

Low Carbon Scotland GHG Sankey

This one is from the report ‘Low Carbon Scotland: Meeting our Emissions Reduction Targets 2013-2027 – The Draft Second Report on Proposals and Policies’ available on the Scottish Government website.

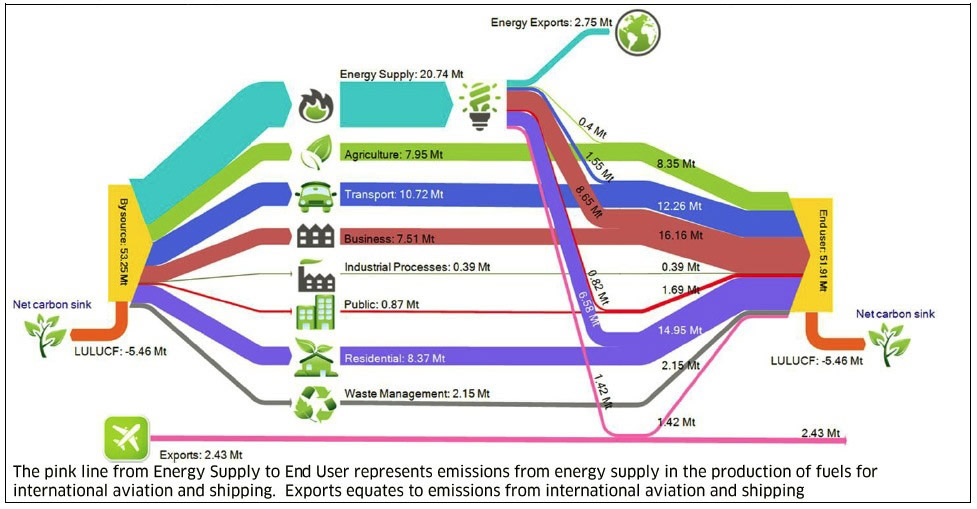
The Sankey diagram visualizes “By Source and End User GHG emissions transfers for Scotland in 2010 (Mt CO2e)”. Data for the diagram from “Greenhouse Gas Inventories for England, Scotland, Wales and Northern Ireland 1990-2010 (Aether and AEA, AEAT/ENV/R/3314)”.
For those wondering (like I did!), ‘LULUCF’ is for ‘Land Use, Land Use Change and Forestry’.

According to the report

“Scotland accounts for only around 9% of the UK’s total energy consumption, but is rich in energy resources and produces a diversity of energy supply. The energy supply sector covers the production of energy, and in particular the generation of electricity, either in power stations or in large industrial process (like refining). Energy supply in Scotland produced 20.7 MtCO2e of greenhouse gas emissions in 2010, which equated to 37% of Scotland’s total in 2010.”