Tag: GHG

Embodied Carbon Sankey Diagram

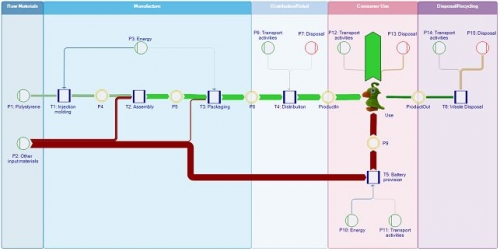
I found the idea behind the below Sankey diagrams quite compelling. Both are from the user manual of the ‘Umberto for Carbon Footprint’ software by ifu Hamburg. They are also the makers of e!Sankey, and it seems as if most of the e!Sankey software features are also included in this new software for modeling and calculating product carbon footprints.

I played with the demo models included in the trial version, one of which is for a toy parrot. The product life cycle is modeled from cradle-to-grave with the raw materials, assembly, distribution, use, and end-of-life phases. Using embodied carbon data from an LCI database for the raw materials and energy used along the life-cycle, a carbon footprint is calculated. The material and energy flows related to the product manufacturing and use are then shown as a Sankey diagram.

The Sankey view can be switched to an ’embodied carbon’ or carbon load view, which shows the ‘carbon rucksack’ of the product as it cumulates along the supply chain.

In this second Sankey diagram the arrows representing the greenhouse gas burdens caused by the waste disposal phase are turned around, so that both the upstream supply chain as well as the downstream processing after the product use are visually added. They form one large Sankey arrow (shown in green here) for the product’s carbon footprint.

This is of course not a Sankey diagram drawing software, but rather a modeling or calcalation tool for carbon footprints. Still, I think, this is a fine use case where Sankey diagrams unfold their full visualization power. It can be immediately grasped which stage of the life cycle, or which raw material or energy supply contributes most to the carbon footprint.

Note: Have added this to the software list.

World and US GHG diagrams from WRI

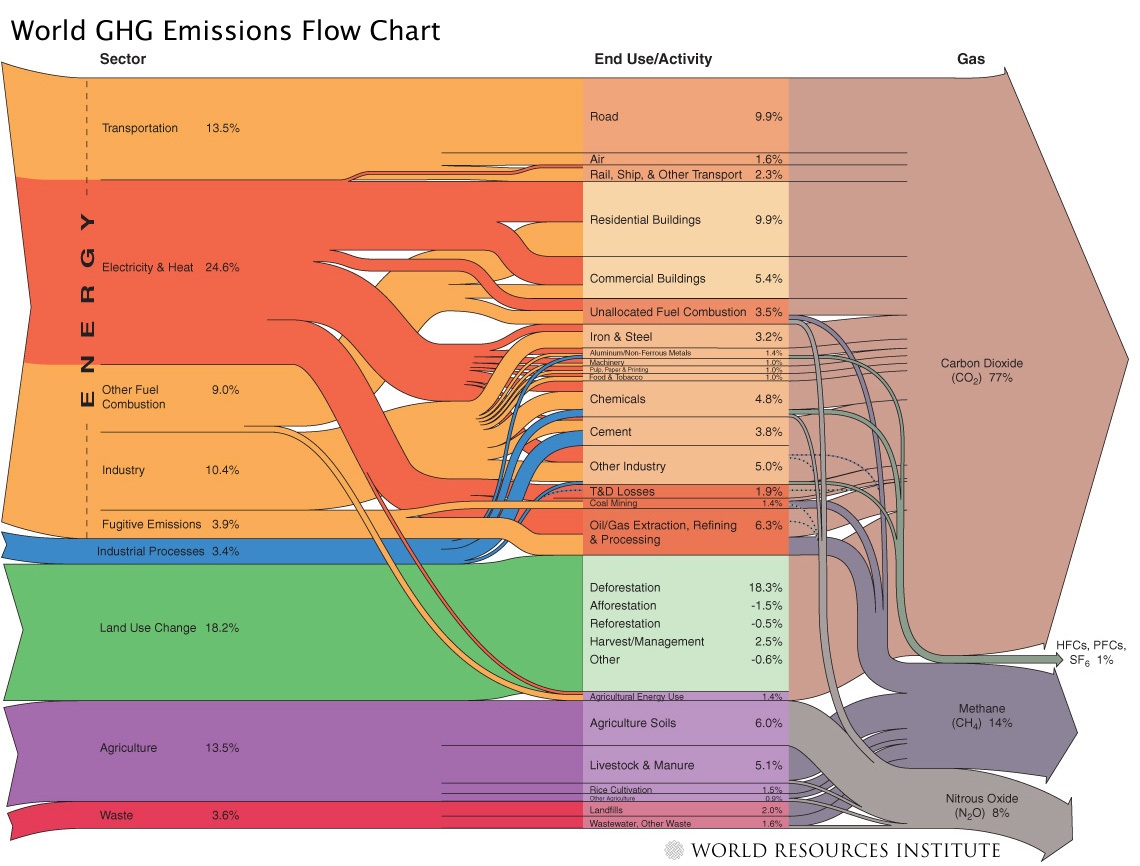
Last August I reported about a Sankey diagram showing World GHG emissions, published on the website of the World Ressource Institute (WRI). I couldn’t show the diagram due to copyright concerns in that post, but to my delight, Tim Herzog, co-author of the WRI publication and Director of Online Communciations at WRI in a comment to my post granted permission. Thanks, Tim!

So here it is:

The diagram shows the activity sectors from which of greenhouse gases (GHGs) originate. The largest portion is from energy generation (including transport), followed by land use change and agriculture. Direct emissions from other industrial processes (other than combustion processes) and waste is comparatively small. The arrows on the right side give a breakdown into the individual gases with carbon dioxide as the main greenhouse gas (77%) followed by methane and N2O.

All data is for 2000 and given in CO2 equivalents with the GWP 100a weighting factors for methane, nitrous oxides, HFCs and PFCs from the IPCC 1996 report. The total quantity is an estimate of 41755 MtCO2 equivalent. Land use change shows negative numbers too, because credits can be given for reforestation (newly planted trees absorbing CO2).

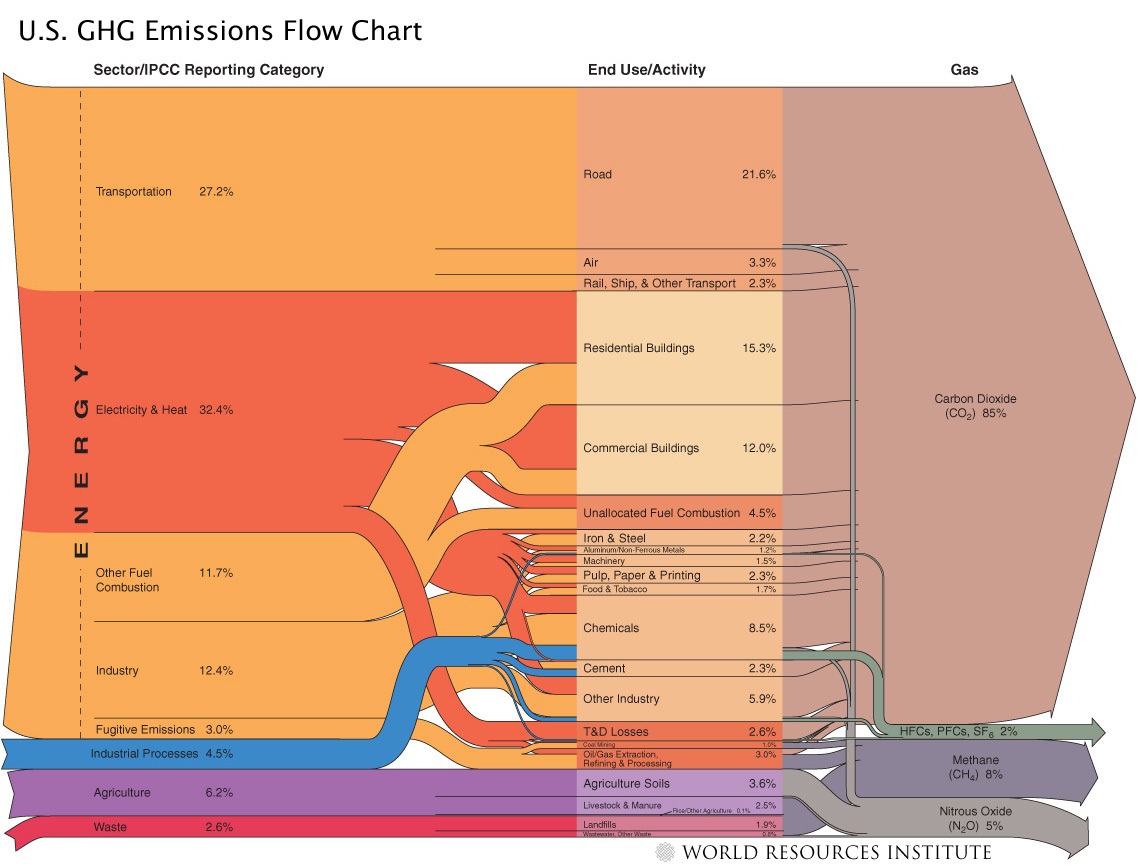
Here is the Sankey diagram from the same report just for the 2003 GHGs in the United States.

The overall CO2 equivalents are 6978 Mt in the US in that year, but the portion of GHGs from fuel combustion is higher. CO2 is 85% of the GHGs. For more details on the US GHG Sankey diagram, go to the WRI web page.

Kudos to the makers of these Sankey diagrams. Apart from the rich content they convey, they are also beautiful examples of how elegant Sankey diagrams can be.

Sankey Diagrams for Carbon Footprint

I was pointed to an article on carbon footprint, that used Sankey diagrams to underline a method of carbon accounting along the supply chain. This article was part of the “first virtual global conference on climate change” CLIMATE 2008 that took place, yes, exclusively on the Internet from November 3 to 7, 2008. (I must admit that this event passed largely unnoticed by me, although reading some of the papers now gives me the impression that it would have merited more attention.)

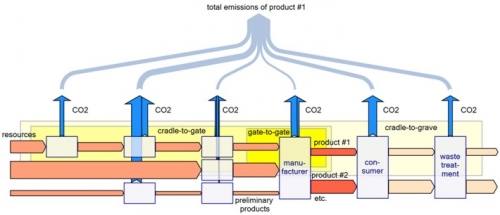
The paper titled “Carbon Accounting and Carbon Footprint – more than just diced results?” by Prof. Mario Schmidt from Pforzheim University describes the various approaches of corporate carbon accounting, carbon footprint of products, and Life Cycle Assessment LCA. Schmidt introduces a method that allows determining “cumulative emissions … at each point of the supply chain up to the POS”, and calls this the CO2 backpack.


The four Sankey diagrams above from the article illustrate the idea. They show (1) the CO2 equivalent emisisons along the supply chain, (2) the value added in a supply chain, (3) the relative CO2 emissions per value of product, and (4) the total emissions of the products along the supply chain with sectoral gate-to-gate, cradle-to-gate or crade-to-grave approaches.

This article is well worth reading, you should do so while it is still available online. Update: the domain has gone offline
Schmidt is an acclaimed expert in Sankey diagrams and has also published on the history and methodology of Sankey diagrams.

World Greenhouse Gases as Sankey

A great Sankey diagram is available in the Charts&Maps section on the website of the World Resources Institute (WRI), “an environmental think tank that goes beyond research”.

It shows the sectors from which greenhouse gases (GHGs) are released (such as energy generation, land use change, agriculture) and the end use areas or activities, through which CO2, methane and others gases are relased.

Data is for 2000, the diagram was published in 2005. A very well done Sankey diagram indeed, and highly educational.

Unfortunately a request for showing this Sankey diagram here on the blog was not granted by WRI, and an attempt to purchase the publication right (OK, it was not an attempt, it was a price inquiry only) was in vain.

I have to respect WRI’s copyright policies, so you have to click here to view the World GHG Sankey diagram, or download the large version PDF.

They also did a Sankey diagram on U.S. Greenhouse Gas Emissions, available on their website and as a PDF. Enjoy!

Greenhouse Effect Explained with Sankey Diagram

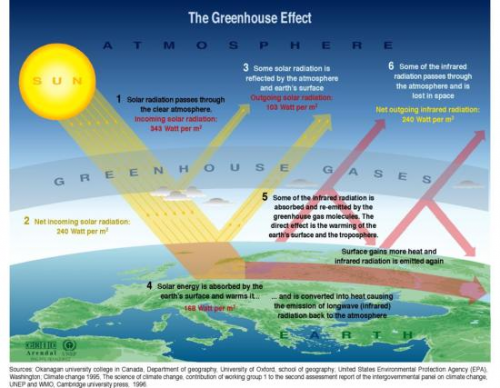
Doing a Google image search on ‘greenhouse effect’ brings up numerous versions of a diagram, that shows solar radiation partially being filtered by the atmosphere, partially hitting earth’s surface. This energy heats the earth, a part is being reflected as infrared radiation, where it is not able to escape fully due to greenhouse gas molecules from man-made emissions’ accumulated in the atmosphere.

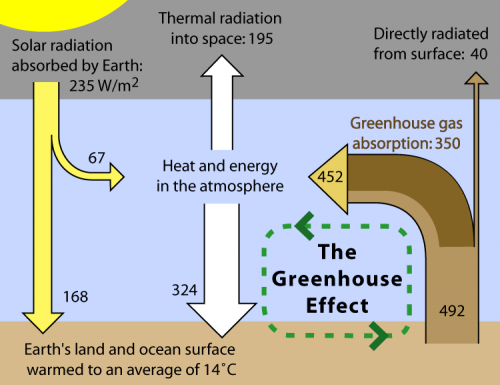
While some of these greenhouse effect diagrams use simple arrows, some of them show the energy levels with Sankey-like arrows.

Wikipedia has one of these as an illustration for the article on the greenhouse effect. Originally designed for Global Warming Art it is also available in the Wikimedia Commons in Finnish and in Japanese.

Many of the “normal” diagrams are very appealing, and I especially like the one’s that target at kids or students. However, the diagram using Sankey arrows conveys more information. Check for yourself by comparing the two examples above.

Greenhouse Gas Emissions in the U.S.

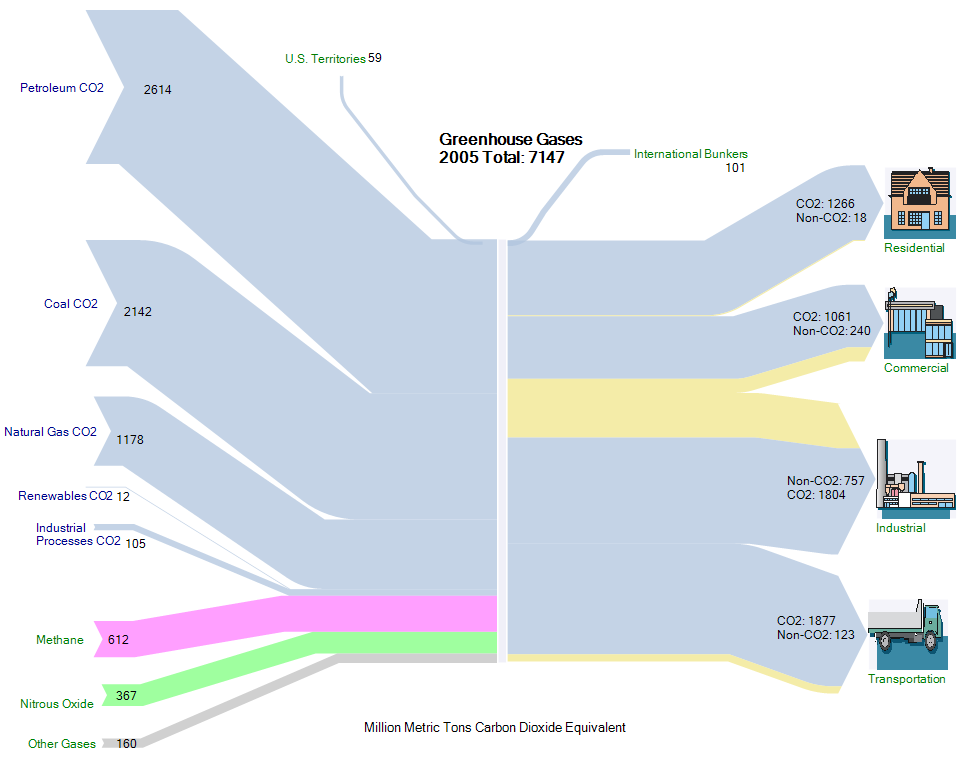
The Energy Information Administration (EIA) of the U.S. Department of Energy (DOE) publishes an annual report on the Greenhouse Gas Emissions in the US economy. The executive summary of the 2005 report shows a Sankey diagram on page xv.

This Sankey diagram shows on the left side the different sources of CO2 (mainly combustibles), and on the right hand side the industrial sectors (residential, commercial, industrial and transport) that contribute to the CO2 release. Emissions are in million ton CO2-equivalents.

The original Sankey diagram from the report has been reproduced with the e!Sankey software, and is shown below. Footnotes have been omitted, for full detail please refer to the original source.