Tag: MFA

New blog on MFA diagrams

A new blog dedicated to Material Flow Analysis (MFA) diagrams is available over at blogspot.

Material Flow Analysis (also refered to as Material Flow Accounting) is a research topic that focuses on specific substances or material flows on a macro level. Typically the system boundaries are a region or a country. Urban metabolism studies also use MFA diagrams. A key feature is the representation of stocks (storage or accumulation of material) within the system.

I have previously presented MFA diagram samples here on the blog that have Sankey diagram characteristics (i.e. arrow magnitudes proportional to flow quantities, directional arrows).

Here are two examples of MFA diagrams from the new blog for you to enjoy:


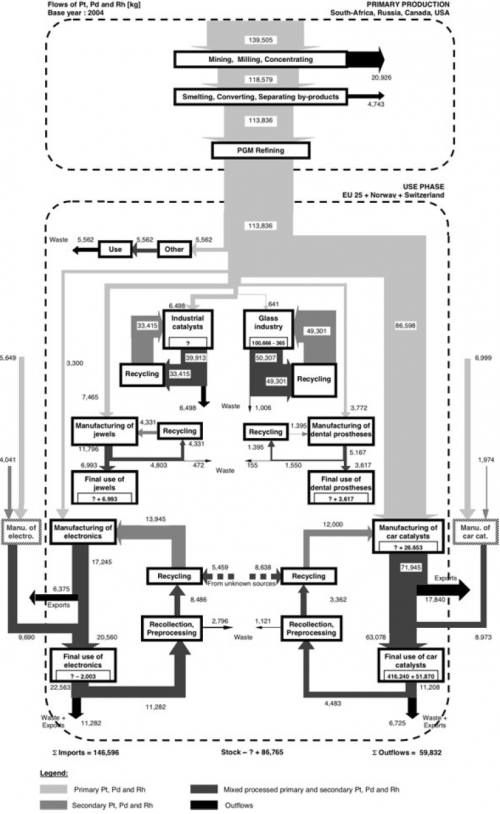
Platinum Flows in Europe. Source: Saurat, M., Bringezu, S., 2008. Platinum Group Metal Flows of Europe, Part 1 (via MFA diagram blog)


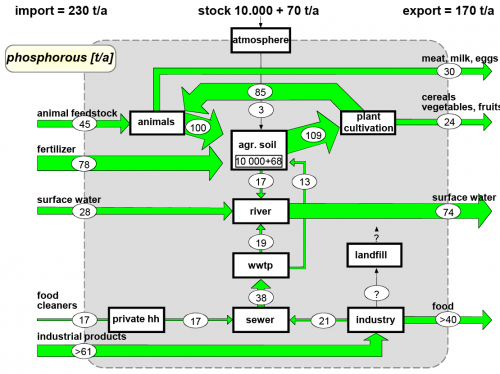
Phosphorus Flows. Source: Paul H. Brunner, 2007. MFA of regional lead flows and stocks [t/y] (via MFA diagram blog)

Make sure you visit the MFA diagram blog from time to time (I have put the link in the blogroll on the right), to see new interesting diagrams. I will also try to present some of them here…

Material Flows on the Island of Hawai’i

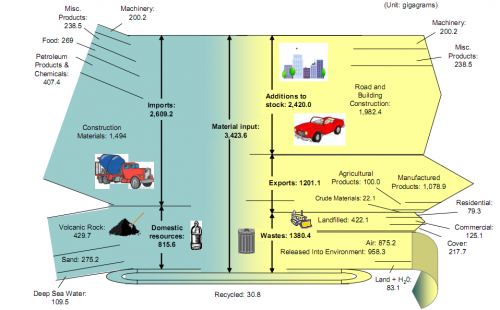
A group of graduate students form the Center of Industrial Ecology at Yale University in 2005/2006 researched the material flows on the “Big Island of Hawai’i”. Their research report (which can be found on the website of the Kohala Center) shows two Sankey diagrams, one of which is shown here.

Material Flow Accounting (MFA) “is the study of material flows on a national or regional scale. It is therefore sometimes also referred to as regional, national or economy-wide material flow analysis.” (Wikipedia). MFA is a research field in industrial ecology. As the authors of the report write,

Using an island as a unit of analysis is valuable both to the researcher and to those interested in the sustainability of the island itself. The researcher benefits from the island’s clear boundaries (most often defined by a surrounding water body) and a relative advantage in data collection provided by the fact that borders are monitored. Material flows are therefore relatively easier to understand on islands than in larger, more complex non‐island systems.

I have been posting about the use of Sankey diagrams in MFA before, and with few exceptions (Material Flow Sankey Diagram of Japan), have found that examples of Sankey diagrams for national MFA accounts typically are limited to selected bulk materials (e.g. biomass in Switzerland, gold flows in the U.S.).

Flows in the above Sankey diagram for the island of Hawai’i are in gigagrams (kilotonnes) and refer to the year 2005. Inputs are shown on the left side, and the fate of those inputs can be seen as exits to the right. More than 75% of the material flows are imported from off the island, the majority of these flows (57%) are construction materials. Consequently, road and building construction are the largest net addition to stocks with almost 2,000 kilotonnes.

The Sankey diagram has some minor flaws, regarding scale of the flows. Look for example to the division of the landfilled waste arrow (422 kt) into three almost equal portions, which are supposed to represent 79.3 kt, 125.1 kt and 217.7 kt. Also the width of the volcanic rock input flow (429.7 kt) is about four times the width of the machinery input flow (representing 200.2 kt). Still, I think it is a good Sankey diagram, and I wouldn’t mind joining the research group on their next visit to the islands…

Gold Flows in United States

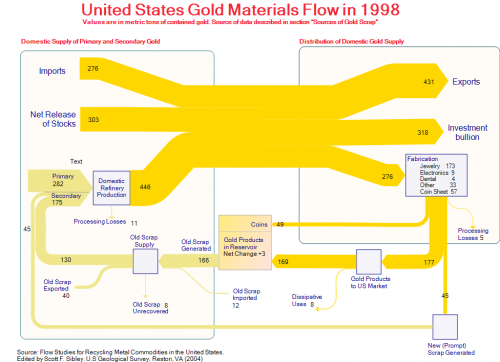
This Sankey diagram was posted as a sample on the e!Sankey Forum. It shows the gold flows in the United States in 1998. The original data is from ‘Flow Studies for Recycling Metal Commodities in the United States’ (edited by Scott F. Sibley. U.S Geological Survey, Reston, VA (2004)). Values are in metric tons of contained gold.

The left part of the diagram shows domestic supply of primary and secondary gold, as well as imports to the U.S., the right part distribution and use of gold. The U.S. is a net gold exporter. 318 metric tons gold bullion went to Fort Knox (presumably) that year. 276 metric tons were fabricated into products, mainly jewelry. At the same time 175 metric tons of new and old gold scrap were recycled. Along with the 282 metric tons out of primary production they are fed back into the production cycle.

The diagram has gold/light brown colored Sankey arrows that go along well with the topic. A text label has been forgotten in the left part.

Swiss Biomass Sankey Diagrams

Gabor Doka pointed me to a publication by the Swiss EPA (Federal Office for the Environment, FOEN). The publication titled “Biogene Güterflüsse der Schweiz 2006” (‘Flows of biogenic goods in Switzerland in 2006’) features many different Sankey diagrams. “Biogenic goods are defined as goods of biological origin, excluding those of fossil origin”. Data is based on Swiss statistical figures and valid for 2006. Available in German only (Download PDF 7,5 MB).

The overall structure of biomass flows is given in a generic layout and as Sankey diagrams with proportional arrow magnitudes for mass flows (unit is in 1000 tons, based on dry matter) as well as for energy content (in GWh, based on lower heat value of dry matter). These overview diagrams are structured in three columns ‘Production’, ‘Conversion’, and ‘Use/Disposal’. Imports are from top, exports to the bottom. This very clear structure for both mass and energy flows makes the complex diagrams easier to comprehend. These overview Sankey diagrams are available for download as a separate PDF file (still 3,2 MB)
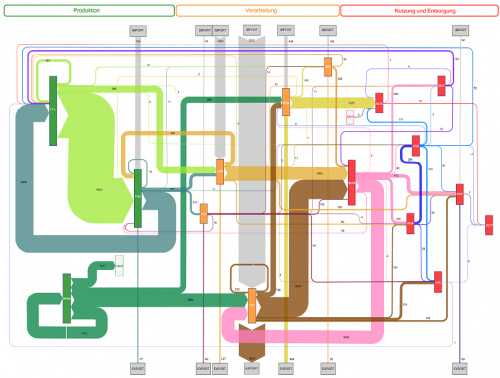
The main diagram is then broken down into individual Sankey diagrams for the different sectors involved, such as plant production (PLB), animal farming (THA), and forestry (WAW) in the production column (orange colored processes), or food industry (LMI) and wood/paper industry (HPI) in the conversion sector (green colored process). Finally, in the use/disposal sector (red colored processes) we find goods consumption (WAK) along with energy generation and waste treatments.

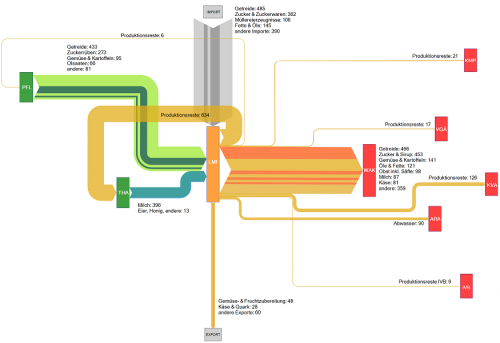
This is the sectoral Sankey diagram for the food industry in Switzerland. We can see that a large part of the biomass for food production is imported, and that most production wastes are fed back into animal farming again. The red boxes are different waste treatments receiving input from the food industry.

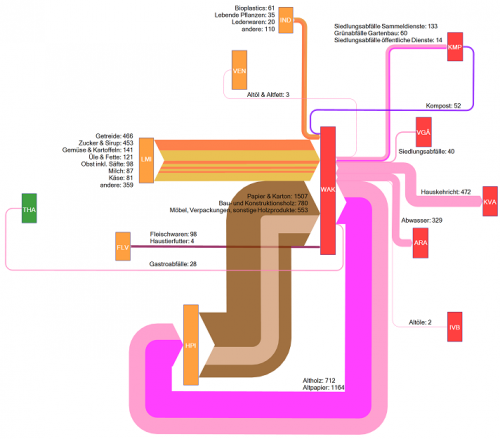
The above is the goods consumption section. Main biogenic goods inputs are from food industry and wood/paper industry. The meat input is rather small comparatively. A big chunk of the mass output (namely waste wood and waste paper) feeds back into the wood/paper industry. 472.000 tons ended up in waste incineration that year, some 329.000 tons in waste water.

The Sankey diagrams in the study are interesting to browse and reveal a lot more interesting facts. The stuctured approach with the breakdown into smaller diagrams is very useful. The authors Baier and Baum from ZHAW at Wädenswil have done a great job in compiling this.

“The results of this study will serve as useful decision aids for strategic planning and assessments concerning the potential, use and management of biogenic resources (…) makes it possible to detect quantitative changes that occurred during a given period of time and to reach conclusions concerning the efficiency of measures taken.

Actually this way of visualizing statistical data with directional (from-to) information attached to it could serve as a role model for other national mass and energy accounts, I think.

Uh – this has become my largest post ever 😮 . But I think this was well worth it and the publication merits it. Your comments appreciated.
Materials Accounting and Mass Balances

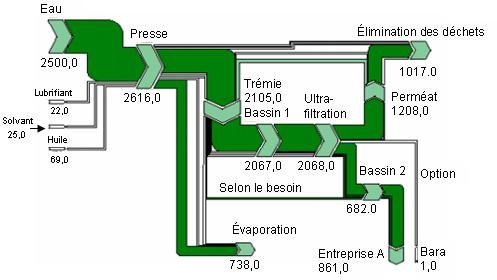
Environment Canada in 2001 published a Pollution Prevention Planning Handbook, a 153 page guidance manual on processes and techniques for pollution prevention. Update: The original handbook has been removed. Sucessor pages have been put online, and can be found here.

In appendix B of the handbook materials accounting and mass balances are presented as one technique. The text states that

materials accounting and materials mass balances can be presented in a tabular or diagrammatic format. A Sankey diagram provides one useful method for representing a picture of material flows and balances.

and a sample Sankey diagram is shown.

Although not all quantities of the individual flows are shown, and there is no reference to the unit used, I think this is a fine example of using Sankey diagrams. The mass imbalance at the first process “Presse” (at the very left) is clearly visible. From the neighboring downstream processes you can see that at least 2105 units (to “Trémie”) and 738 units (to “Évaporation”) leave the process, that has inputs of only 2616 units. The diagram was made with S.Draw.

Lying with Sankey diagrams (2)

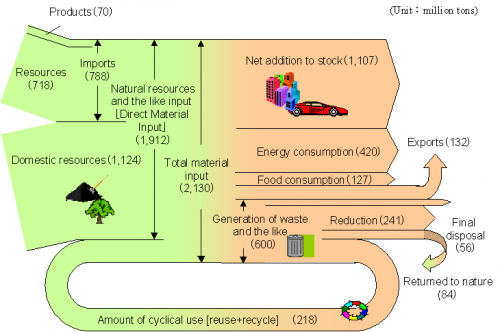
The below Sankey diagram of the ‘Material Flows of Japan in the FY 2000’ has been published by the Japanese Ministry of Environment (環境大臣) and has been reproduced in a number of publications and presentations (sample PPT). Similar charts, representing the inputs into the Japanese economy and the outputs are available for subsequent years.

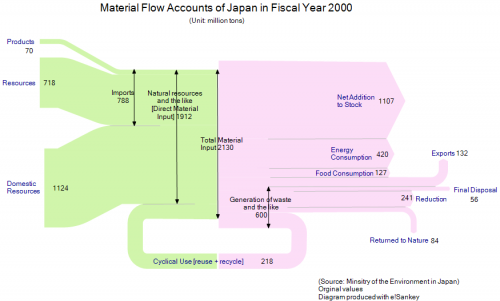
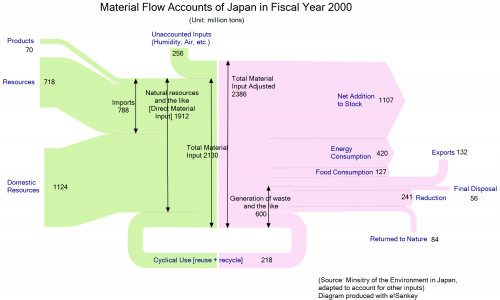
When I copied the values of the Sankey diagram and re-designed it (see pic 1 below), it quickly became obvious that the inputs (2130 Mio. tons) don’t match the Outputs (2386 Mio. tons). After some research I finally detected the reason for the mismatch in a footnote to the diagram in a press release by the ministry. It said that, “due to intake of moisture, etc., total output shall be larger than total material input.” This footnote might have been dropped unintentionally when using the diagram in other publications. I wouldn’t really call this “lying” (as the title of the post implies), but maybe negligence. I wonder if anyboy doubted the numbers when looking at the diagram?

In the second diagram below I adjusted this difference of 256 Mio. tons on the input side.


Another rather surprising thing in this Sankey diagram is the fact that the domestic food consumption within Japan (127 Mio. tons/year in 2000) was almost as high as the total quantity of material being exported (132 Mio. tons). Taking into account, for example, the number of cars being exported from Japan, and their weight, this sounds a little unlikely. However, I think that many of the produced goods might be hidden in the “Net Addition to Stock”.

And for the readers who study Japanese … Sankey diagram : サンキーダイアグラム

Sankey Diagrams in Material Flow Accounting

Another field where Sankey diagrams are used widely is Material Flow Accounting, the analysis of material flows on a national or regional level. MFA focuses on bulk materials or individual substances (e.g. zinc, copper, cadmium) and the quantities in which they enter, leave or accumulate in a national economy.

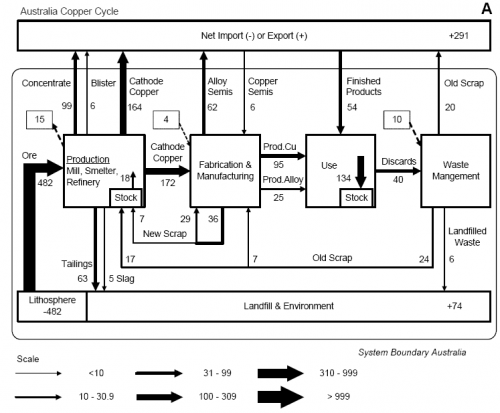
The diagram below is from a peer-reviewed paper presented at the 4th LCA conference in Australia (van Beers, van Berkel, Graedel: The Application of Material Flow Analysis for the Evaluation of the Recovery Potential of Secondary Metals in Australia, 2005). It shows the copper flows within the system boundary of Australia, the unit is Gg/year (= 1000 metric tons per year).

This “clustered” Sankey has six different flow widths, grouping together flow quantities within a specific range (e.g. <10, 10 < 30,9, …). Flows larger than 999 Gg/year are not shown any wider. This avoids that very large quantities “spoil” the whole diagram, as smaller flows become less significant in Sankey diagrams to scale.

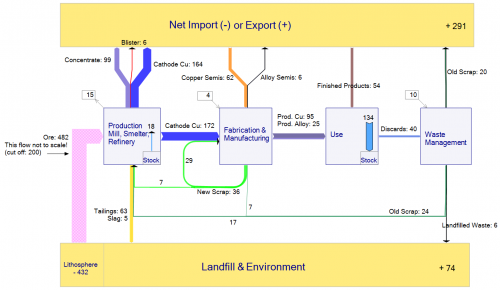
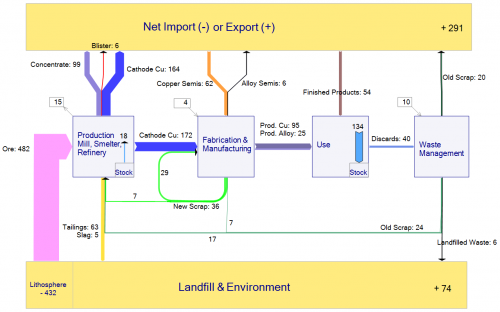
An alternative way to overcome the problem or very wide flows in a Sankey diagram spoiling the chart would be to define a cut-off quantity. Flows that are large than the cut-off quantity are excluded from the scale, and are shown with a hatch or moirée pattern. The two Sankey diagrams below were made based on the data from the above publication. The first one shows the large “Ore” flow with a cut-off level at 300 Gg/year (an additional note warns the reader that this flow is not to scale”, while the second diagram is fully to scale.


Very thin arrows additionally get explicit arrow heads to be able to identify their flow direction.

Feel free to comment