Tag: nutrient

Making it look nicer…

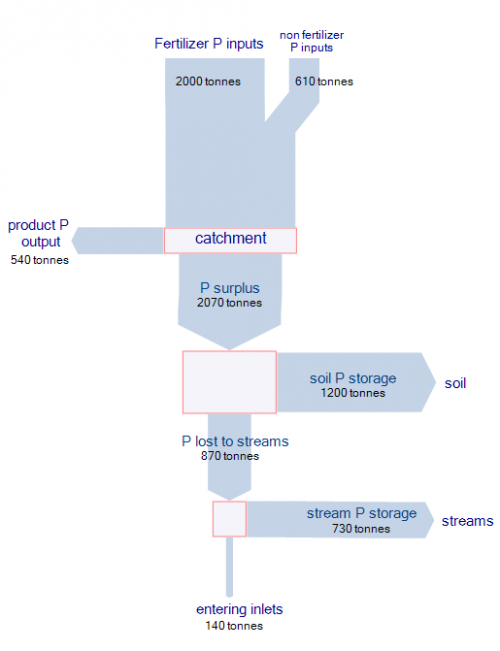
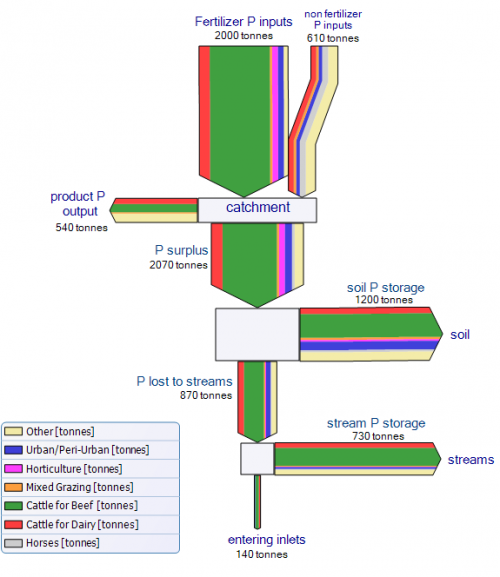
Reading on one of my favorite blogs actually made me take a harder stance on the Sankey diagram I presented in my last post. Following Kaiser’s attitude of making it better rather than only criticizing, I redesigned the Sankey diagram of phosphorus flows in the Peel-Harvey catchment area.

In the first version I didn’t differentiate the various sources of phosphorus, but only used one color for the overall flow quantity. Introducing nodes dramatically improves the comprehensibility and the mass balance check for the flows branching off sideways. There is some redundancy in the labeling of the flows, but I left it to stick as close to the original Sankey diagram as possible.

The second Sankey diagram is even closer to the original one. I tried to match the colors as much, and also introduced a legend. Please note that, since I didn’t have access to the raw data, I just approximated the flow values. Because of the multi flow arrows, I decided to leave a border line at each arrow, and to put heads to the first two input flows (‘fertiliser P input’ and ‘non fertiliser P input’) to better be able to distinguish them.
Sankey for Phosphorus Flows and their Origins

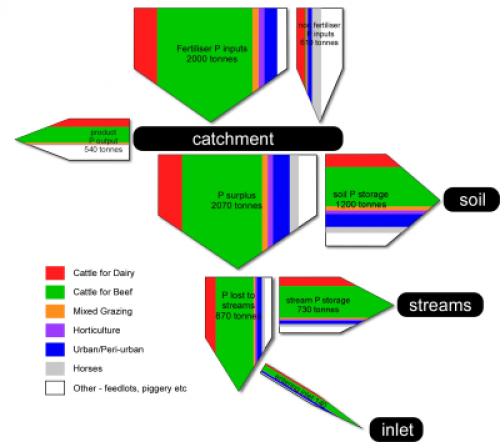
A paper on ‘Guiding BMP adoption to improve Water Quality in various Estuarine Ecosystems in Western Australia’ by Nardia Keipert from the University of Western Australia’s Department of Agriculture and Food shown on the ARWA Ecohydrology website features a Sankey diagram on phosphorus flow in a catchment area.

The stacked Sankey arrows show “the relative contribution from each land use sector”. The origins of the nutrients are cattle for dairy, cattle for beef, mixed grazing, horses, and others. From statistical data on nutrient use efficiency, which ranged from 10 to 50 %, the researchers estimated the accumulation of phosphorus in the soil and streams, and the final delivery into the ocean.

The Sankey diagram does look kind of … errh, how should I say, …. “different”. But this is mainly due to the fact that flows that accumulate in a storage branch off to the side. The arrow magnitudes are actually to scale. To check this, add the horizontal flow to the storage and the vertical flow.

The full report is here, the Sankey diagram is shown on page 8.

Update: see my followup post to this