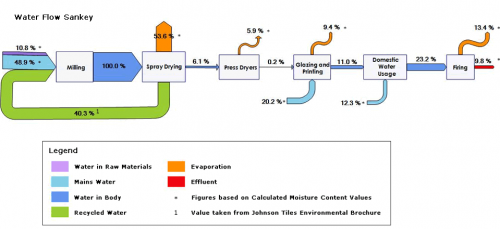
Followup to a 2012 post on water footprint: here is another water flow Sankey diagram, this time from tiles production.
Consulting firm Ceram calculated a water footprint of tiles produced for Stoke-on-Trent based Johnson Tiles in 2010 and illustrated the study with this Sankey diagram.
No absolute values are given, but water losses along the processing steps (based on the 100% of water input) are shown in percent.
