When German Chancellor Angela Merkel meets with POTUS today, one topic that’s most likely going to be addressed is the trade deficit between the United States and the EU, Germany in particular.
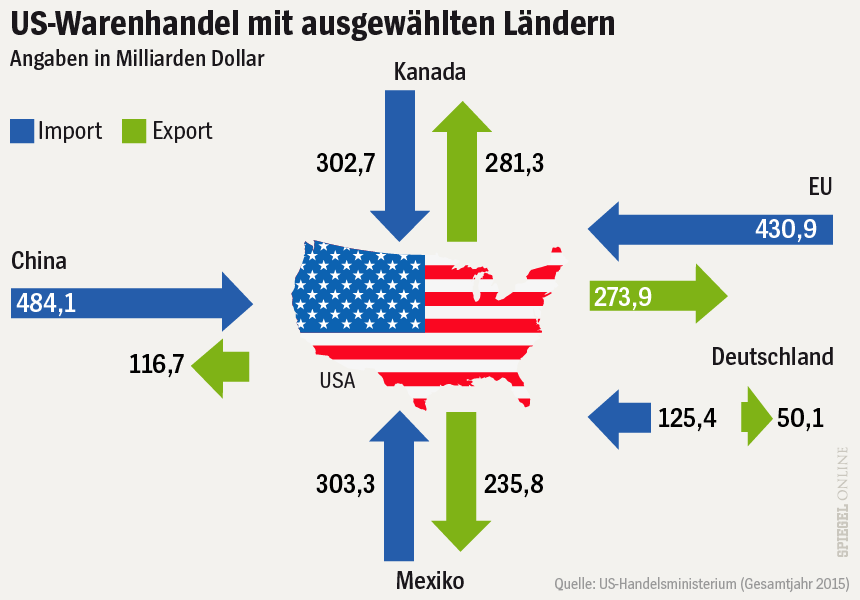
The Spiegel, a major German news outlet, has illustrated recent articles on this subject with the figure below. It shows the volume of trade between the United States and ‘selected countries’ (China, Canada, Mexico and the EU) in 2015. The values indicate the value of goods exported (green arrows) to these countries, and imported (blue) from them into the U.S. in billion US$.
Source: Spiegel Online
The interesting thing in this infographic is that the length of the arrows represents the value of goods traded. For example, the arrow for exports from the US to Europe (274 bnUS$ in 2015) is little over half the length of the blue incoming arrow (431 bnUS$ in 2015). This works fine, with the only exception being the green arrow for exports to Mexico.
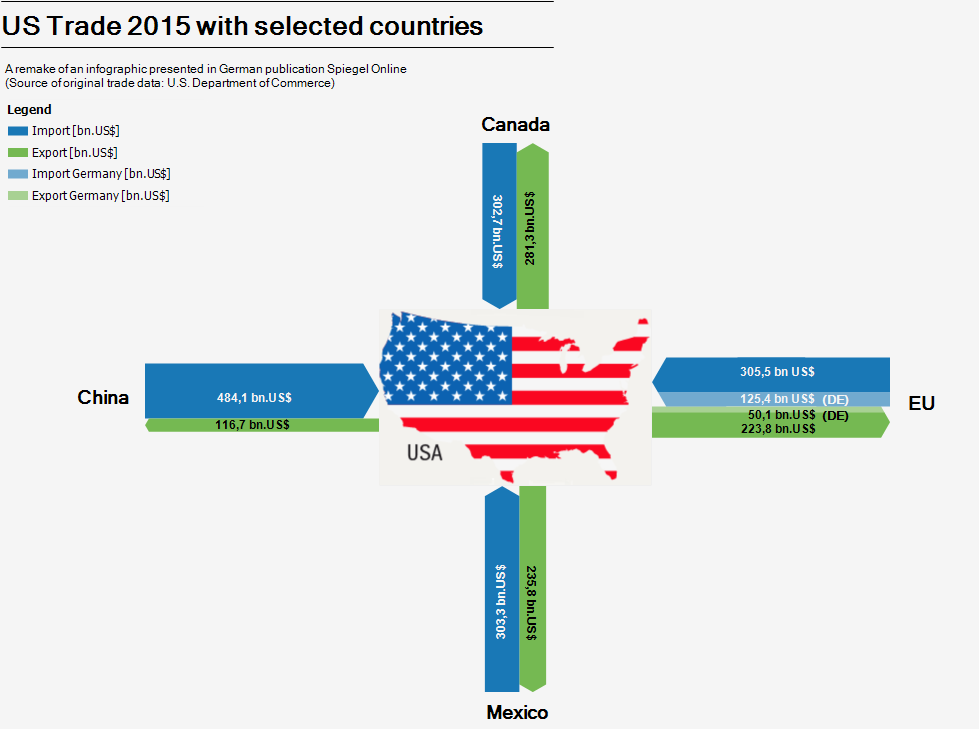
This infographic of course invited a remake as Sankey diagram. As you all know, in Sankey diagrams the widths of the arrows represent the quantity.
I did two or three different versions, all very similar to the original infographic in style and color, even using the lower states map icon (sorry Alaska and Hawaii). I was not sure at first whether the separate arrows for Germany were values already included in the EU trade volume, or if they were meant to be on top of it. A quick look into the original data revealed that indeed they are included in the EU figures already. I therefore decided to highlight the German share in the Sankey diagram with a slightly brighter color, but keep those arrows stacked.
Here is my Sankey diagram version of the Spiegel infographic.
Not sure which version I prefer, but using the length instead the widths of the arrows to represent the flow quantity is definitely a unique approach. Worth sharing with you, I think.

