Month: February 2010

Madrid spendings in culture 2009

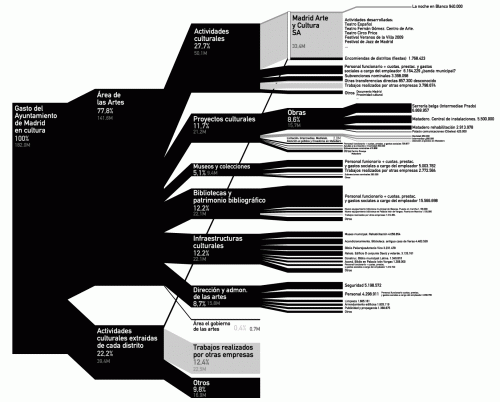
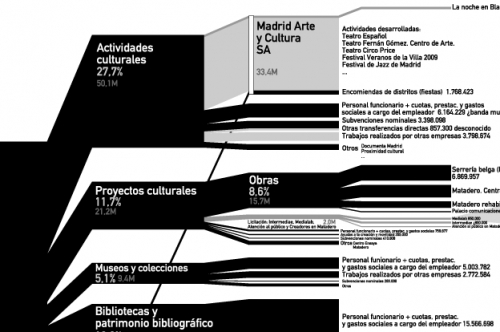
kulturometer.org presented a fantastic diagram that shows the municipality of Madrid’s spendings in cultural activities in 2009. By compiling data from numerous tables, tender calls, and administrative bulletins, they managed to stunningly visualize what one commenter called an ‘information overload’ (‘apagón informativo’). Click on the diagram to enlarge.

This is a breakdown diagram, or ‘diagrama de brazos’, that shows the distribution of the overall cultural budget (182 Mio Euros in 2009) by sectors, sub-sectors, and even into individual types of activities or projects.

It somewhat reminds me of Nicholas Rapp’s AIG bailout diagram, even though less colorful…

Each branch of the diagram is labeled with the relative weight in percent, as well as the absolute value in millions of Euros. The color scale indicates the reliability of the data, either non detailed estimate (light grey), published estimate (grey), or published budgeted data (black).

Here is the full diagram in large scale (PDF) with an additional breakdown of one particular section (Medialab) at another scale and full legend and annotations
Watch a slide show to learn more about the diagram (starting p 19)
– And finally, a blowup detail of a diagram section:
PET flows in the US

Polyethylene terephthalate is something everyone of us uses almost every day. Better known by its acronym PET it is used for plastic film and soft drink bottles.

The following Sankey diagram is from a presentation on PET beverage bottle recycling by Brandon Kuczenski and Roland Geyer of Donald Bren School of Environmental Science and Management at the University of California, Santa Barbara. It was held on the First Symposium on Industrial Ecology for Young Professionals (SIEYP) in Tempe, AZ on May 17, 2009.

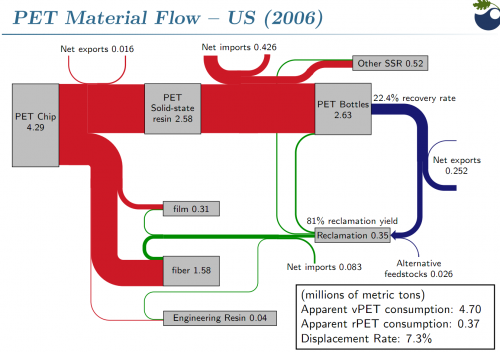
The Sankey diagram shows PET flows in million metric tons in the U.S. in 2006. 4.29 mio tons of pet flakes are being produced, of which 2.63 mio tons are transformed into PET bottles (other products are PET film and PET fiber). Only 22.4% of these bottles could be recovered after use. This “loss” is being represented by the blue flow which has only a fourth to a fifth of the width of the red entry flow. Recovered PET bottles are exported or reclaimed, closing the loop at least for a fraction of the PET flows.

Interesting Sankey diagram. Congratulations to Kuczenski/Geyer for visualizing this so clearly. Your comments appreciated

More Minard

Just back from a holiday, and in order not to keep you waiting for new Sankey diagams … shuffle, shuffle, draw … here are two more one from the Mondays with Minard series at the Cartographia blog (see previous post).

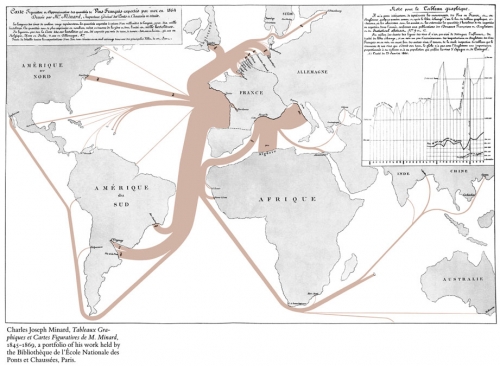
The first one shows French wine exports in 1864. A lot of the good stuff goes to European neighbours, the U.S., to Brasil, Uruguay and Argentina [the latter today an exporter of great wines themself]. But there are also some gourmants that appreciate ‘un verre de bon rouge’ in remote places such as India, China, and of course the outer French territories (Mauritius and Reunion). Not sure what the unit of flow is, as the image is to small to read.

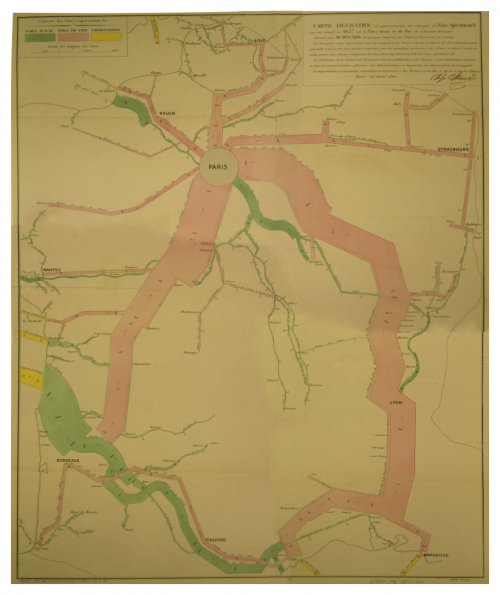
The second one is a map of France that shows the transport of wine and spirits in 1857.

Most of the good stuff is shipped to Paris along rivers (green) and major railway lines (pink). Road transport seems to have been excluded. You can also see the transports to the ports for exports (yellow). Flows are in tonnes, but the band itself shows transports in both directions. This national map could be seen as an inset into the above map.