Month: February 2014

Energy Balance Comparison

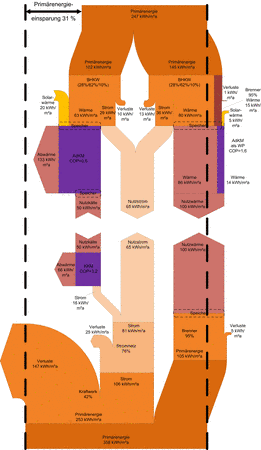
The summary of a research project under participation of Kempten University of Applied Sciences is presented on a project webpage. It also features this comparison Sankey diagram.

These are in fact two Sankey diagrams “mirrored” at an imaginary horizontal center line. The bottom one facing upwards is the diagram for the baseline representing convential energy systems. The upper one with flows pointing downwards has the same amounts of useful energy (trigeneration 30 % electricity, 47 % heat und 23 % cold), but using 31% less primary energy (see black dashed lines).

Careers in Science, Diagram Remake

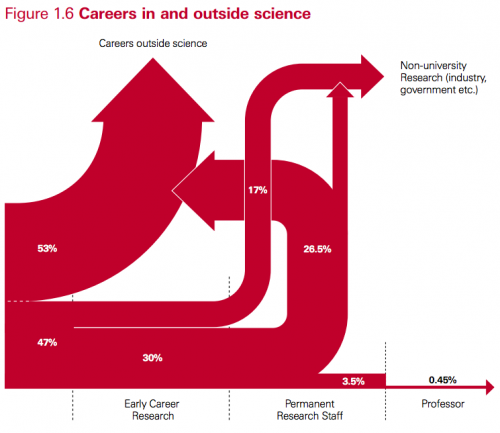
Merian who runs the Boreal Perspectives blog posts on a Sankey diagram that visualizes academic career paths.

This was originally shown in a 2010 Royal Society policy report entitled “The Scientific Century: securing our future prosperity”. Merian raises concerns about the quality of the diagram. She goes: “So what’s so bad about the chart? Some obvious issues:

  • It is unclear what goes in on the left and to a lesser degree what is covered by the end points. The report indicates in a footnote that the term “science” is used “as shorthand for disciplines in the natural sciences, technology, engineering and mathematics,” but the three documents used for input categorise the fields in different ways, and there is no indication which fields exactly would have been selected.
  • Line thickness is not proportional to percentage weight. The 26.5% and 30% streams have the same thickness, and the 17% stream is much less than half the thickness of either. The 3.5% stream is more than half the thickness of the 17% stream.
  • Why does “Permanent Research Staff” not end in an arrow? And why does the arrow from “Permanent Research Staff” to “Careers Outside Science” bend backwards (to suggest it is a step back in one’s career, that is, an implicit value judgement?) and then not even merge with the output stream?
  • Does it really mean to suggest that no one goes from “Early Career Research” (that is, a post-doc) to “Career Outside Science” (or to industry research)? In my experience, watching post-docs, that is quite a common choice for post-docs precisely because non-academic jobs may be offering better pay and conditions, or because they don’t have a choice at that stage.”

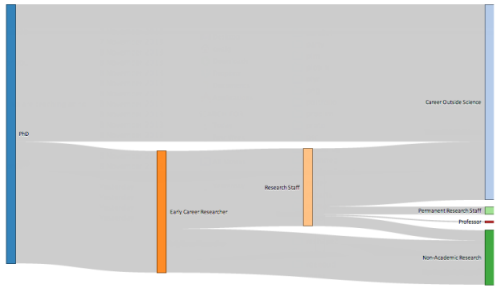
She then presents a remake of the above diagram made using the Sankey plugin for d3.js

Indeed, the distribution diagram without the arrow heads seems to be better suited. The overall appearance is much more calm.

Merian, however, concludes “no graph would have been more useful”.

CamU Climate Change Mitigation Research

A research group headed by Andrew Skelton and Sören Lindner at Cambridge University’s Centre for Climate Change Mitigation Research is “developing environmentally extended input-output models to assess greenhouse gas reduction across production layers and supply chains of the global economy.”

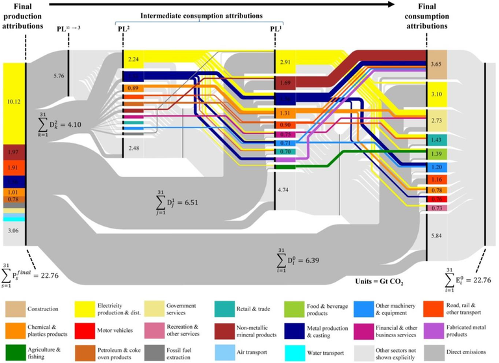
The figures on their webpage describing the group’s activities include this Sankey-style mapping of “flows of embodied emissions through the global economy [that] … help to visualise and explain … differences between production-based and consumption-based accounts of emissions”.

Unfortunately no high-res image is available. However, one can find the producing sectors on the left side (each of which identifiable by its own color) and their responsibility for a share of the 22.76 Gt direct CO2 emissions. On the right side one can see the consuming sectors and their use of input that has embodied emissions from the supply chain (two intermediate transformation steps in the centre).

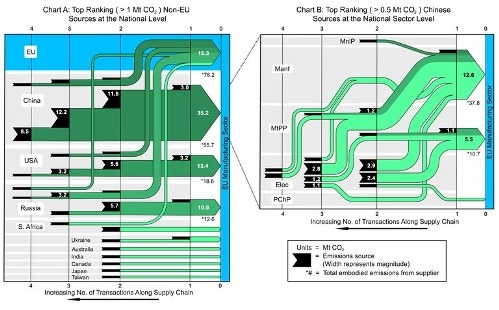
Additionally one can find these two diagrams for embodied emissions from supply chains. The left one is for all major non-EU sources, the right one a breakdown for products and intermediates sourced from China.

Data is based on input-output (IO) statistics and Life Cycle Assessment (LCA). An interesting topic and a good use of Sankey diagrams IMHO. Read more on the research web page that also has links to the scientific publication made by the group.