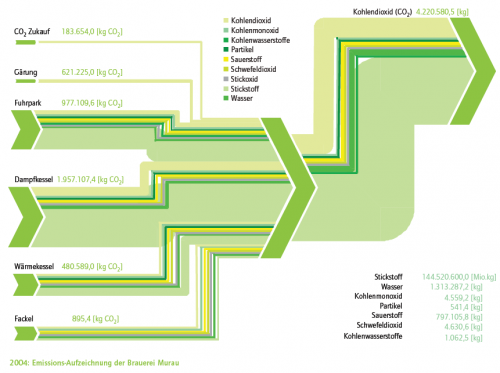
A company brochure commemorating ’10 Years of Environmental Management’ at Murau Breweryin Austria features this sparkling green Sankey diagram:
The diagram visualizes gaseous emissions (carbon monoxide, carbon dioxide, oxygen, nitrogen, …) from different equipments (e.g. steam boiler, fermentation tank, flare, …) in 2004. Carbon dioxide emissions are given in absolute values as flow label. All flows in kilograms (Note: nitrogen quantity (‘Stickstoff’) probably erronously labeled ‘Mio kg’ in the legend).
Good job … Prost!

1 Comment
Comments are closed.