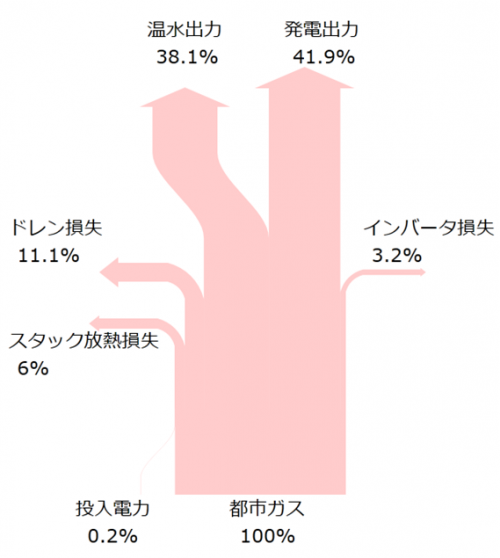
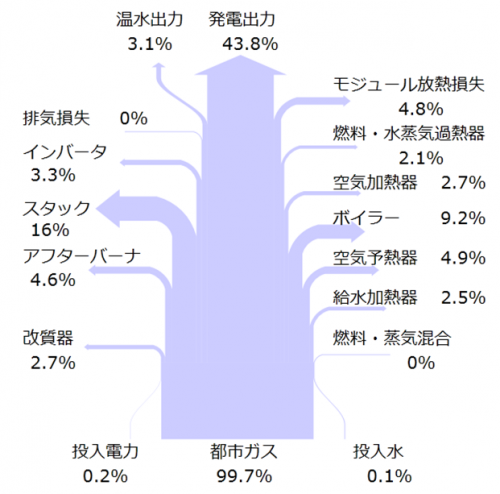
Found the two Sankey diagrams on the website of the Exergy Design Joint Research Lab of Osaka University in Japan. The diagrams are for enthalpy and exergy in a Solid Oxide Fuel Cell (SOFC). Can’t fully understand what it means, but both are simple breakout Sankey diagrams that could also be presented as a pie chart.
The first one is titled “Enthalpy Sankey Diagram”:
The second one is a “Exergy Sankey Diagram”:
Anybody care to explain more?
Looking at the choice of color one could be led to believe that enthalpy is female, while exergy is male.


1 Comment
I’m not an expert, but exergy is the available energy to perform work, this means that not all energy stored can be transformed, some is lost (entropy). I guess that is why is 99.7%
Enthalpy is the total heat change in a chemical reaction. I don’t speak Japanese, but I imagine with the diagram they are explaining what is happening with that exergy and enthalpy in a particular process.
Comments are closed.