This website on energy optimized building features a case study of a students dorm building at Wuppertal, Germany. [On a side note: it is quite striking that when I browse for new Sankey diagrams on the web, I come across them on German websites. Herr Sankey could well have been a German…]
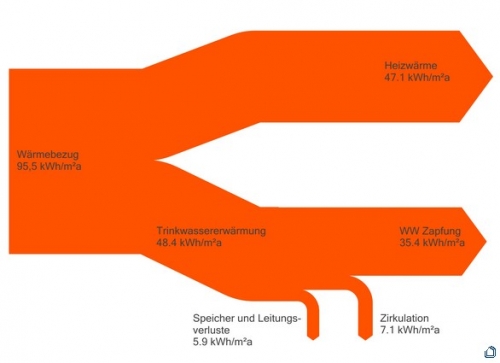
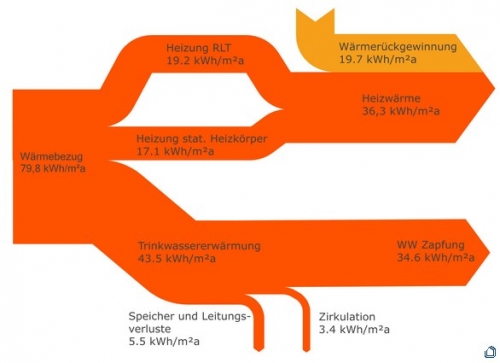
The two Sankey diagrams shown along with the article visualize the heat energy flows before and after the optimization measures taken.
before:
after:
Flows are in kWh per square metre per year. The first diagram breaks down heat consumption into heat used for room heating and for warm water preparation. In the second a new heating system has been installed providing heat mostly over the air circulation system. Only some static radiators remain. [Thanks Thomas for helping me with the translation/explanation].
Apart from the use of a fancy color, the Sankey diagrams are well done and comprehensible. Flows are to scale.

