As a followup to last week’s post on a Sankey diagram from the GEA report. here is another one from the very same report (GEA, 2012: Global Energy Assessment – Toward a Sustainable Future, Cambridge University Press, Cambridge UK and New York, NY, USA and the International Institute for Applied Systems Analysis, Laxenburg, Austria).
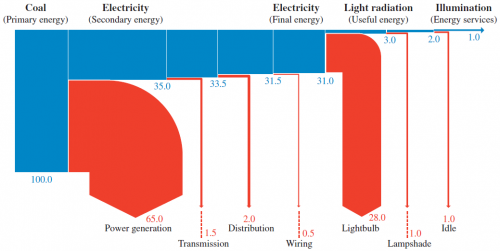
This one is an example for losses along the energy supply chain.
The description of the diagram on pp. 116/117 says:
“As an example of energy chain efficiency, Figure 1.13 illustrates the energy flows in the supply chain for illumination services (lighting). In this example, electricity is generated from coal in a thermal power station and transmitted and distributed to the point of end-use, where it is converted to light radiation by means of an incandescent light bulb. Only about 1% of the primary energy is transformed to illumination services provided to the end-user.”
The Sankey diagram shows the primary energy as 100% on the left and branches out the losses at each conversion/transmission step. The actual useful energy (the “energy service” of providing illumination) is only 1%. So in this example one unit of energy service requires 100 units of primary energy, clearly pointing to “abundant opportunities for improving efficiency exist at every link in the energy chain” (p. 116).
I have presented a similar Sankey diagram here before, see this 2007 post ‘What it takes to power a bulb’.
