Tag: map

Global Oil Flows

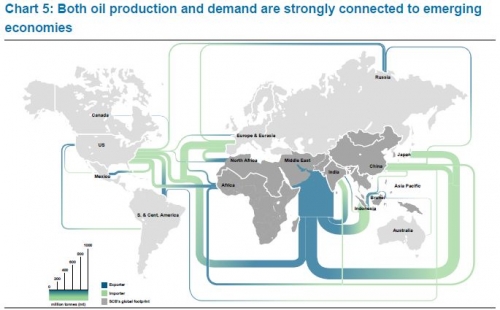
I am back after a few weeks of holiday. To get into posting again, here is a quick one I found at Graphic Design Forum in a discussion thread on software for creating trade flows (in this case oil flows) on a world map.

Flows in million tonnes (per year?). Scale element at the bottom left. No visible arrow direction, but instead a blue to green gradient on each band (blue for export, green for import). Middle East region being the largest exporter remains a problem with a very wide Sankey arrow leaving through the Indian Ocean.

Yet another Sankey map overlay

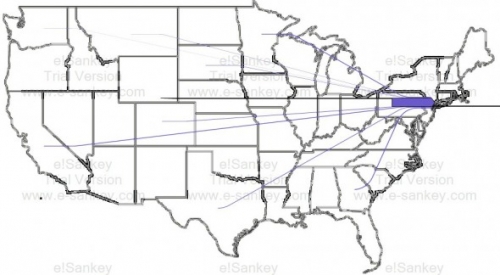
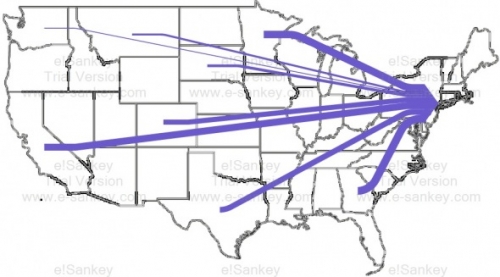
John Cochran blogs about his coursework at University of Virgina. His project on ‘Urban Metabolisms’ has this Sankey diagram of food being transported to New York City. Data is from The Federal Highway Administration (USDOT) Freight Analysis Framework.

The first Sankey diagram shows transports to New York (excluding the Northeastern States and transports within NY). The food supplied by other US states becomes relatively insignificant:


The second one includes food transports within NY state (still excluding the Northeastern States):


John, however has not been satisified with the results of his work. He writes (scroll down to his September 21, 2011 notes):

“Neither produced effective graphics, but what they did demonstrate was the inability of the information to be able to represent food going to New York. (…) As a result, the data “revealed” that we already have a very local food system, when in reality this is not the case; instead, it does indicate how many extra miles are traveled for food around the location of purchase. (…) The images below demonstrate just how disproportionate the amount of miles traveled in New York are to the miles traveled bring food to New York from the rest of the country.”

It remains unclear whether the flows displayed in the diagram are for payload (e.g tonnes of food) or payload distance (e.g. tonne-kilometres). Also, it is not mentioned, whether, for example, water and drinks (typically sourced locally) are included.

I think the idea of thie Sankey map overlay is great, but the issue of spatial representation of (dense) data points has not been adequately adressed. A zoomed NY state would maybe help.
More Minard

Just back from a holiday, and in order not to keep you waiting for new Sankey diagams … shuffle, shuffle, draw … here are two more one from the Mondays with Minard series at the Cartographia blog (see previous post).

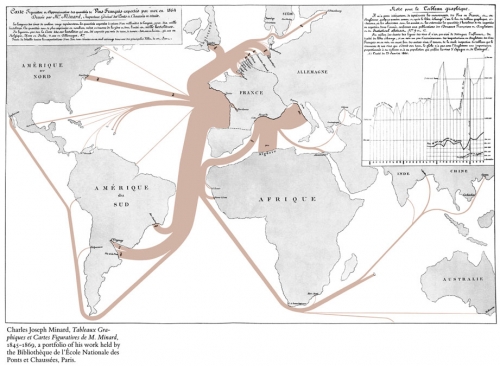
The first one shows French wine exports in 1864. A lot of the good stuff goes to European neighbours, the U.S., to Brasil, Uruguay and Argentina [the latter today an exporter of great wines themself]. But there are also some gourmants that appreciate ‘un verre de bon rouge’ in remote places such as India, China, and of course the outer French territories (Mauritius and Reunion). Not sure what the unit of flow is, as the image is to small to read.

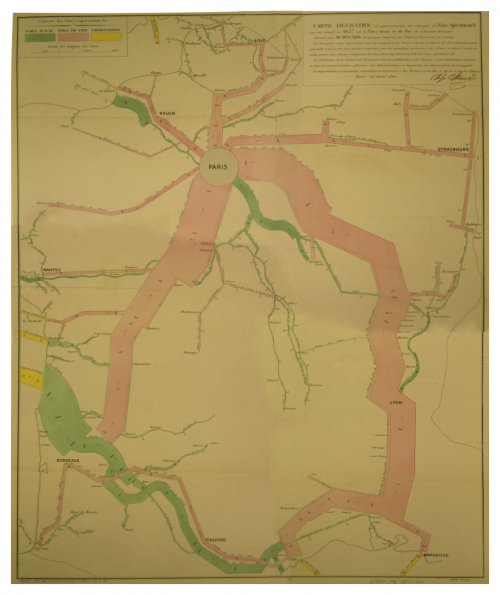
The second one is a map of France that shows the transport of wine and spirits in 1857.

Most of the good stuff is shipped to Paris along rivers (green) and major railway lines (pink). Road transport seems to have been excluded. You can also see the transports to the ports for exports (yellow). Flows are in tonnes, but the band itself shows transports in both directions. This national map could be seen as an inset into the above map.

Cartographia blog shows Minard maps

In 2008, the Cartographia blog started a post series called ‘Monday’s with Minard’. Some people consider Charles Joseph Minard the first to use arrow magnitude in his diagrams to represent quantities. (As a consequence, this means that Sankey diagrams would have to be renamed to Minard diagrams!).

What differentiates Minard maps from Sankey diagrams is that Minard’s fine works always have a geographical relation. The most famous one is his Map of Napoleon’s march to Moscow published in 1869. This “carte figurative des pertes successives en hommes de l’Armée Francaise dans la campagne de Russie 1812-13” shows number of men (as width of arrows), geographic movement of the troops on the map both for invasion as well as for retreat, as well as time and temperature on a separate scale.

Cartographia blog has some other nice examples, two of which are shown here:

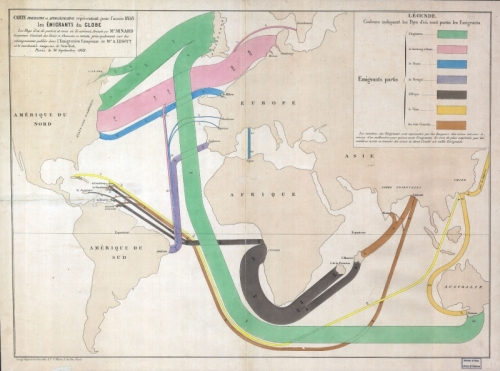
The first shows migration patterns across the globe. Arrows do not have an arrow head but the country of emigration is color coded. The outline of the countries is distorted to accomoadate large flows connected to them. For a detailed description please consider reading the original blog post. This map is similar to the one I showed in this post.

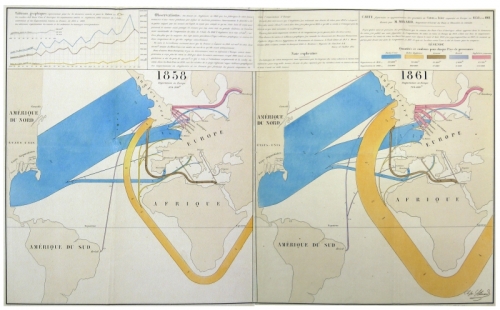
The other is a flow map for wool and cotton for the years 1858 and 1861. “Blue represents cotton and wool from the United States, the orange from British territories in South Asia … One millimeter represents 5,000 tons of cotton or wool.”. As one can see on the 1861 map, cotton imports from Asia have increased dramatically. See the description of the map in the blog post on Cartographia blog.

See all Monday’s with Minard posts here. There has been no activity on the blog since June 2008. I hope to see more of these posts some day.

U.S. Oil Import Sankey Movie

Renown Rocky Mountain Institute (RMI) founded in 1982 by Lovins and Lovins have an interactive oil imports map on their MOVE project webpage.

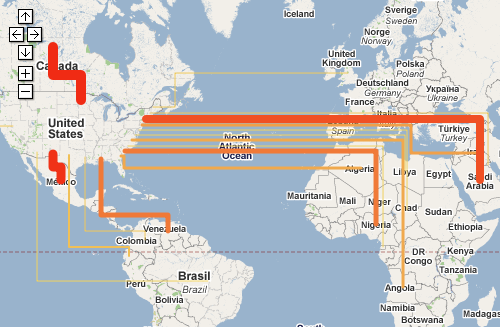
You can see the oil imports to the United States from January 1973 to August 2008 on a map that depicts the flow quantities as Sankey arrows linking the country of origin and the U.S. If you switch to the unit “Dollar”, you can see the value of the oil imported depicted as Sankey arrows.

One can play the the whole 35-year period as a movie, or use the slider on the time line to see individual months. The data used is from publicy accessible EIA/DOE statistics.

The United States is still 60 % dependent on imported oil. MRI’s MOVE project seeks possibilities to reduce foreign crude oil dependencies. The goal is to “get completely off oil by 2050, led by business for profit.”

Go to the RMI movie page and try it yourself. When I did the Lybia Oil Export map last year I wasn’t aware of this Sankey movie, which is of course much nicer.

Showing Migration Flows as Sankey

Most of the Sankey diagrams I come across on the net focus on energy issues, followed by the topics greenhouse gases and material flows of different kinds. Display of cost Sankey diagrams (value streams) is less common, so are people/passenger flows. An interesting approach is presented with Sankey diagrams that show migration flows between countries, or in and out of a region.

The best one I have seen was in this summary report on ‘Europe’s Demographic Future’ published by Berlin Institute for Population and Development. On page 11 you can see the migration flows within Europe (with omissions). The widest Sankey arrows are for migration movements from Bulgaria and Romania, mainly to Spain. There seems to be a lower cut off threshold at approx. 10.000, which leads to smaller flows not being scaled linearly any more. A lot of interesting details in this one… [would have loved to reproduce it, but permission wasn’t granted].

Here are other samples for Sankey diagrams visualizing migration flows (no quantities given, exact time range unknown).

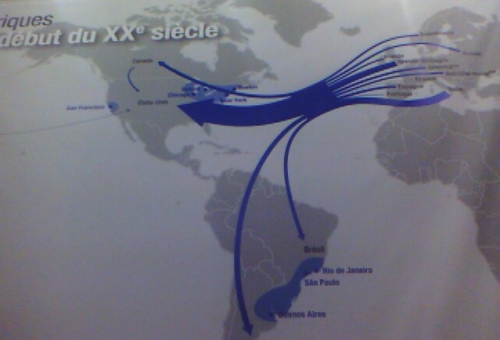
Emigration flows to North and South America in the first half of the 20th century

Refugee flows in Middle East, Africa and Asia in 2006 (clustered quantities)

Both diagrams found on My Paris Your Paris blog

I think Sankey diagrams in this context merit more attention. Will be looking for more of these…

Oil Exports visualized as Sankey Diagram

After my posts on visualizing Rotterdam port’s imports/exports and on Internet traffic maps, I have started to experiment with showing the export quantities and destinations for a certain trade good.

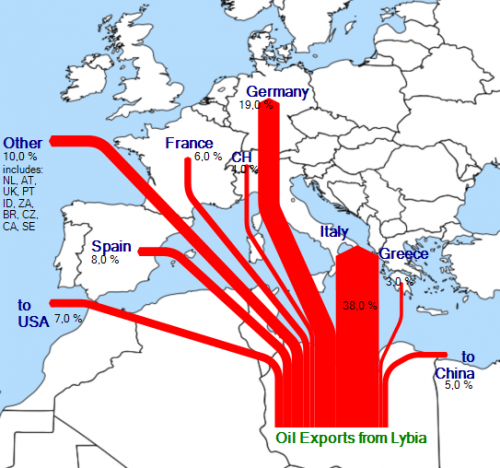
I wanted to do a Saudia-Arabia or Irak oil export Sankey map, but couldn’t find good data. I finally came across this summary on Lybian oil exports, and converted the data from the pie chart Lybian Oil Exports, by Destination, 2006 to a Sankey style export flow diagram.

It was new to me that “Libya has the largest proven oil reserves in Africa” with 41.5 billion barrels, and estimated net exports of 1.525 million barrels per day in 2006.

The underlying map is a crop from a World map found on Wikicommons. I think it could be a little more transparent though…

World Internet Bandwith Sankey

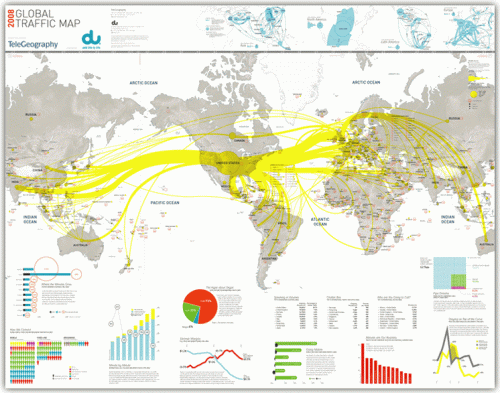
The cutting of two submarine internet cables in the Mediterranean Sea at the end of January, and another one in the Persian Gulf a few days later, was widely reported in the news. The cuts affected internet services and call center operations in large parts of the Middle East and India, sparking discussions about emergency backup plans for offshore software development.

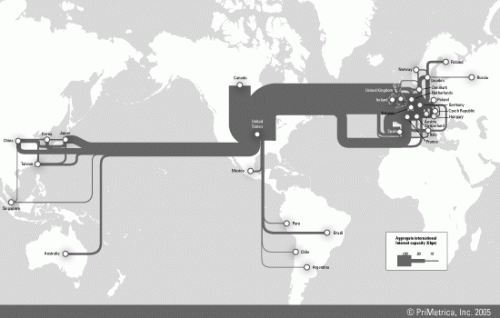
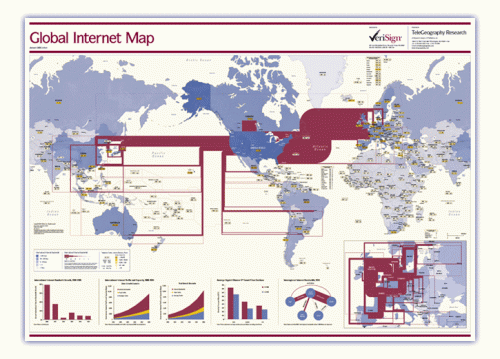
This reminded me of the internet traffic maps I had seen on the Web before. These are available as traffic load maps as well as bandwidth capacity maps of the backbone infrastructure.

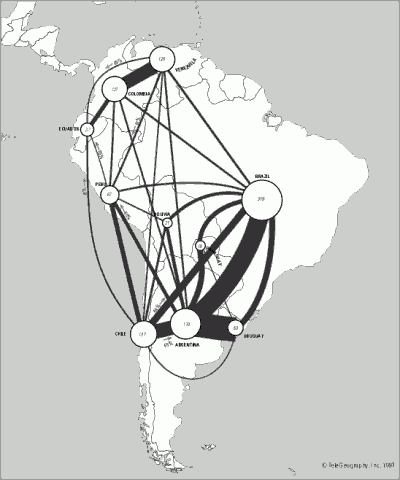
Indeed these maps can be considered as fine examples of Sankey diagrams, with bi-directional (or non-directional?) arrows whose magnitude represent the bandwidth of the transcontinental internet cables. Additional arrow colors could be used, for example, to represent ownership or operation of the cable by different companies.

At the same time the Sankey maps may also serve to indicate communication technology development in different world regions.

BTW, if you want to stick one of these maps prominently on your office wall, they are available as posters here.