Month: February 2008

Another Greenhouse Effect Sankey Diagram

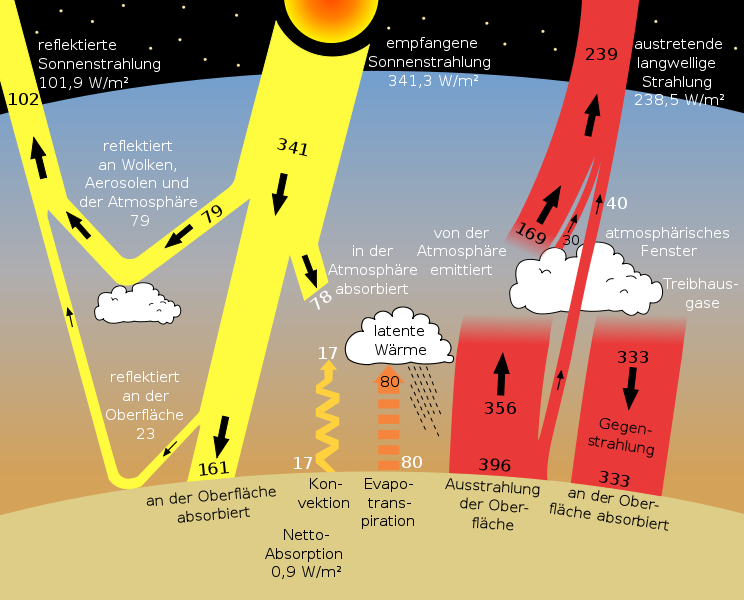
On Wiki Commons I discovered a different Sankey diagram image for the greenhouse effect than the one I presented in a previous post. The diagram is titled ‘sun climate system’, which seems appropriate.

The values are in Watt per square meters. Labels are in German, but if you want to know what they mean, just go to the original Earth Observer (Nov/Dec 2006 Vol. 18 Issue 6) PDF file by NASA and check out page 38.

Energy Losses in Small Fish Trawler Operations

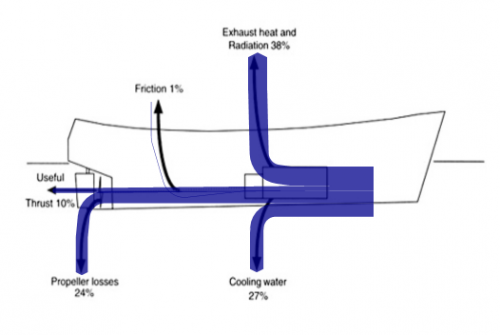
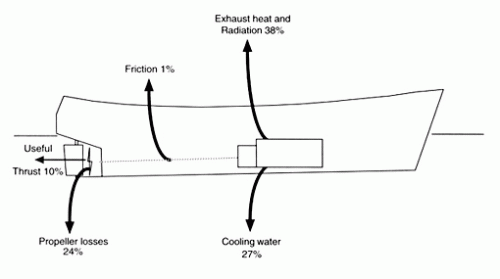
In a report on “Fuel and financial savings for operators of small fishing vessels” by J.D.K. Wilson from Maputo, Mozambique (available on the FAO website), the author explains that in a small slow-speed vessel, only approximately 35% of the energy created from the burning of fuel can actually be utilized to run the propeller, thus can be “spent on useful work such as pulling the net”.

I have “translated” the given values into a Sankey diagram, using the original image as a background layer. This works quite fine, apart from the very thin (1%) flow of friction losses.

On a side note: this is the first time I am presenting a right-to-left oriented Sankey diagram on this blog.

The author concludes, that energy can be saved on the engine and transmission, however the mode of operation (e.g. to reduce the effect of wave resistance), and hull maintenance also play a role. Read more interesting details.

A different power Sankey diagram…

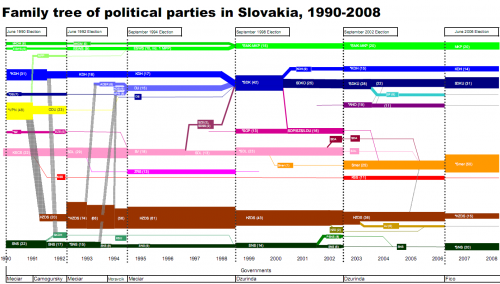
Kevin Deegan-Krause, an Associate Professor of Political Science at Wayne State University has contacted me with a fascinating idea and a unique example of a Sankey diagram. He writes: “I accidentally “reinvented” the Sankey wheel quite awhile ago for a rather odd usage: political party ebb and flow in E. Europe.”

This diagram he presented in a recent post on his Pozorblog shows how parliament seats were allocated to the different parties in the Slovakian parliament from 1990 to 2008, and how seats were shuffled during the six elections that took place during that time.

“As with energy, the number of party seats in parliament is a closed system and there are flows from some to others. This is a highly modified usage, of course, as we do not know in a precise way “where” votes go from one election to the next, so we just fudge at the day of election and just start over (or have invisible reallocations).”

Have a look, for example at the brown brown arrow: The HZDS party has clearly been on the loosing track. On the other hand SMER (shown in orange), a party that emerged as a spin-off from SDL (pink) in 2000, could gain a significant number of seats in the 2002 elections, when SDL couldn’t make it into Slovakian parliament any more. Others pretty much remained stable in their number of seats over the whole observation period.

I am not sure if Kevin uses the “official” colors of the parties (wouldn’t mind tossing my vote for the pink party 😉 ), but a color clustering would also allow to visualize if left, or right, or liberal, or whatever political direction gets stronger or weaker. It would also be a possibility to see, if there is an overall trend in a certain group of countries, such as Eastern Europe, or the apparent growth of socialism in South America.

I am calling for votes on how to name this special type of Sankey diagram. If the first Sankey diagram was for steam power, why not a power Sankey diagram? 😉
Substances in Wastewater Treatment

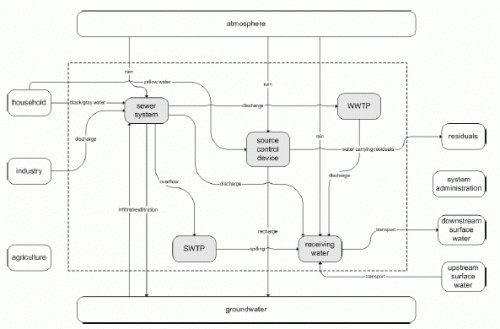
In the Wiki of the CD4WC (Cost Effective Development of Urban Wastewater Systems for Water Directive Compliance) project, I found an interesting Sankey diagram that I wanted to share with you.

This project, funded by the European Commission, deals “with optimising the efficiency of urban wastewater systems with regard to ecological consequences in natural water bodies and with regard to investment and operation costs.”

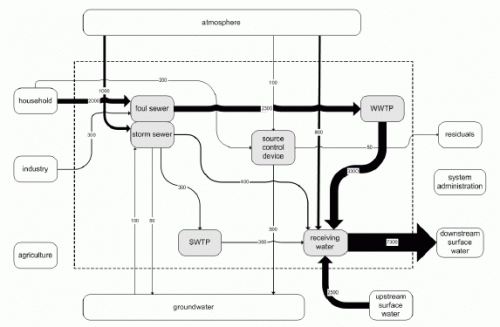
The waste water treatment process system is shown with a schematic flow diagram. For individual substances that can be found in the waste water, the diagram is then displayed with Sankey flows, that represent the quantity. Thus, Sankey diagrams are a possibility for the “determination of fluxes of substances per unit of time”. This presentation is part of a method is coined Substance Flow Analysis.

This presentation is very advantageous: The nodes in the system (the process blocks) remain at the same position, only the magnitude of the arrows changes, when switching to the substance flows view. Flows with large quantities substances are clearly visible.

It would also be a possibility to introduce as a third view (next to absolute water quantity, and substance quantities) the substance concentrations (impurities per m³ of waste water).

World Internet Bandwith Sankey

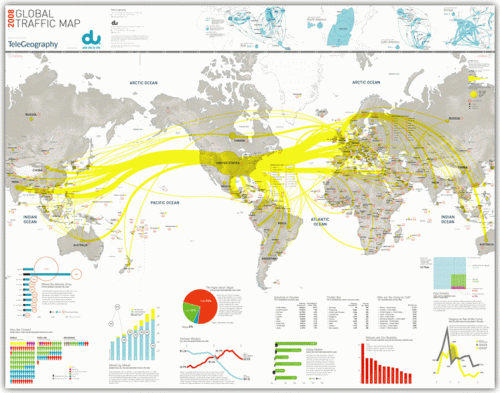
The cutting of two submarine internet cables in the Mediterranean Sea at the end of January, and another one in the Persian Gulf a few days later, was widely reported in the news. The cuts affected internet services and call center operations in large parts of the Middle East and India, sparking discussions about emergency backup plans for offshore software development.

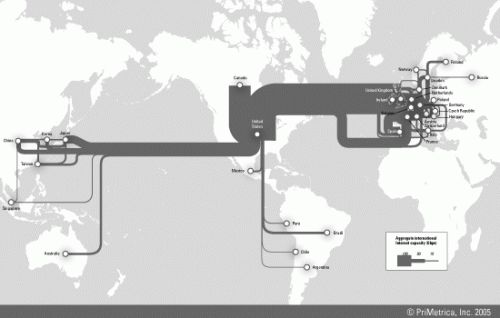
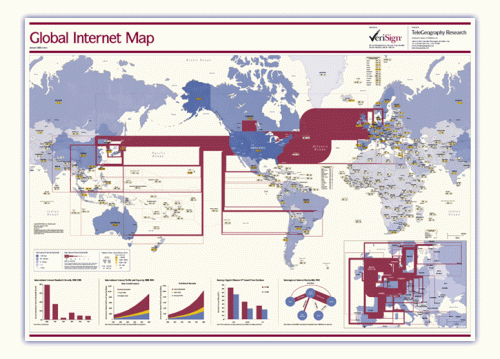
This reminded me of the internet traffic maps I had seen on the Web before. These are available as traffic load maps as well as bandwidth capacity maps of the backbone infrastructure.

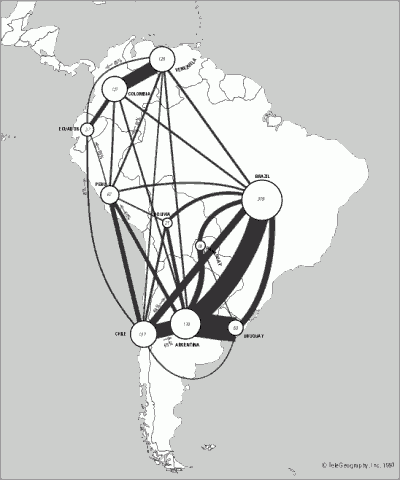
Indeed these maps can be considered as fine examples of Sankey diagrams, with bi-directional (or non-directional?) arrows whose magnitude represent the bandwidth of the transcontinental internet cables. Additional arrow colors could be used, for example, to represent ownership or operation of the cable by different companies.

At the same time the Sankey maps may also serve to indicate communication technology development in different world regions.

BTW, if you want to stick one of these maps prominently on your office wall, they are available as posters here.

Bioclimatic Construction – mais oui, avec Sankey!

The French architecture company AMEO is specialized in construction bioclimatique. The term is probably best translated as ‘bioclimatic building’ … but sound much more chic in French!

The houses they build are made from environmentally sound materials (mainly wood, and other materials such as and cellulose-based materials) where ever possible. Local micro-climate is taken into account, and passive solar energy is used for heating.

Sankey Diagram for a Bioclimatic Building (Source: AMEO Architecture)
Used with permission of AMEO – Source: http://www.ameo-architecture.com

The company presents energy gains and losses and the advantages of the bioclimatic building to their customers using Sankey diagrams as the one shown above. Unfortunately two of the flows have no quantity indicator, and two of the quantity shown in the labels have probably been switched (see thin flow labeled 13779 kWh, but wide flow labeled 5850 kWh). However, I like this diagram for its simplicity.