Month: January 2013

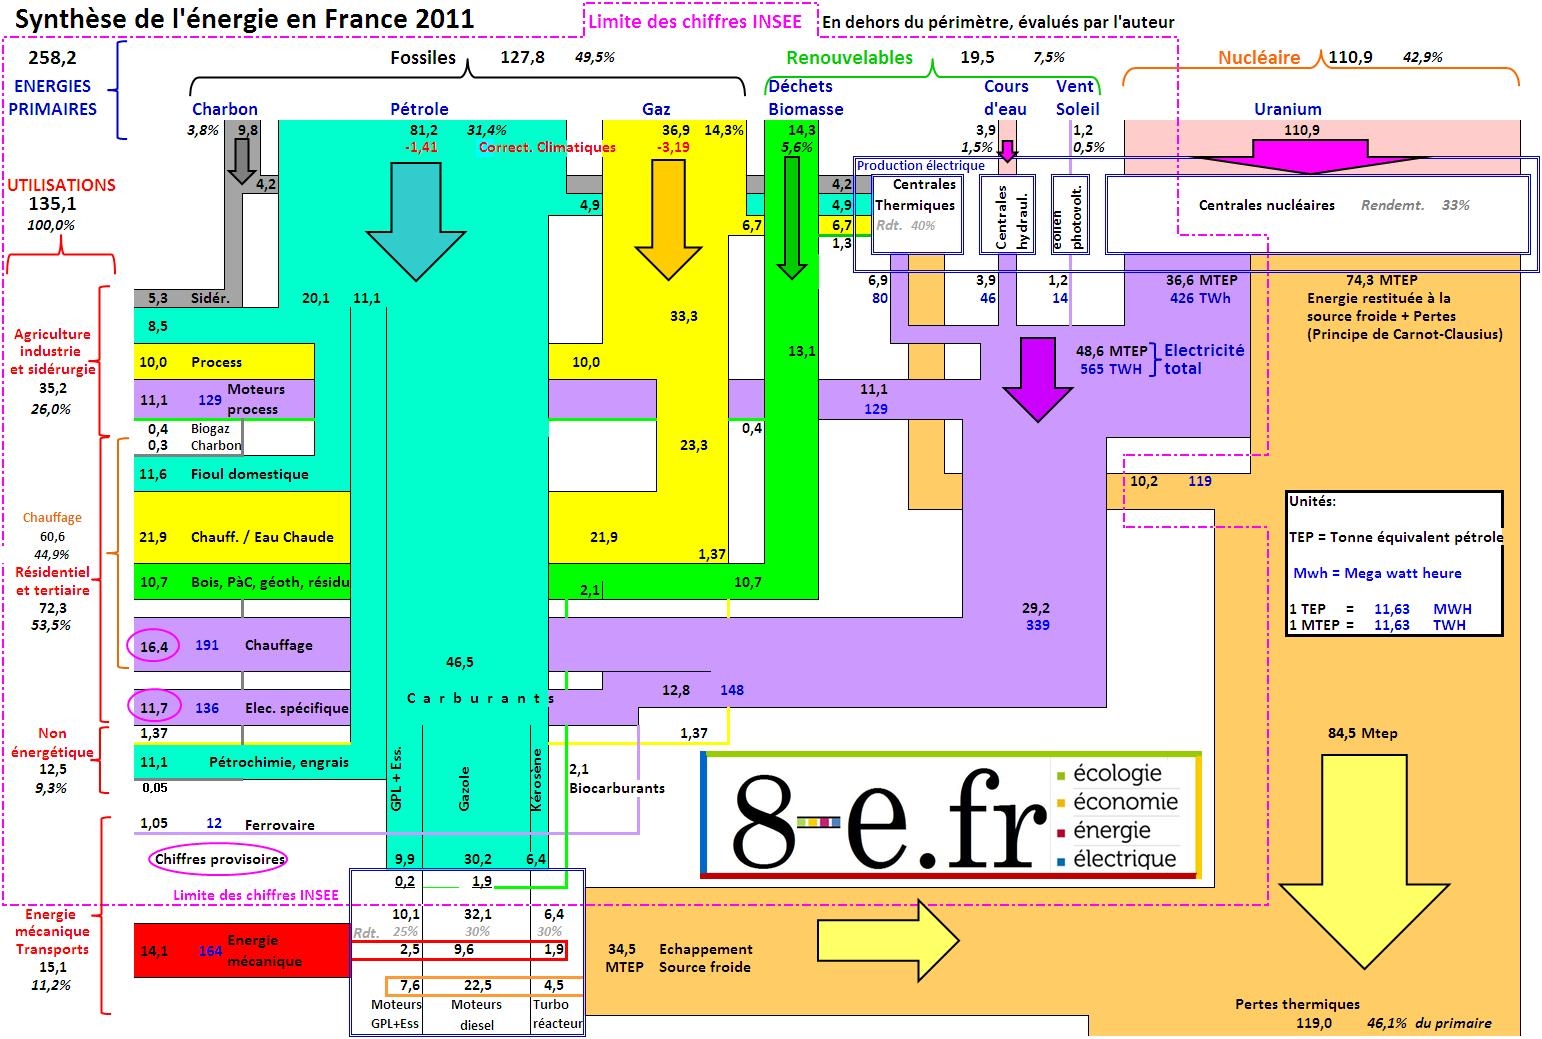
Energy Flows in France 2011, Rectangles

A Sankey diagram made up from rectangles is shown in this post on the blog ‘8-e.fr’ by MM.

The diagram is based on data for 2011 by the French national statistics bureau (INSEE) and the statistics observatory (SoES) of the Ministry for Environment and Sustainability. The author of the post comments that modifications were made in regard to the conversion of primary energy (“Nous corrigeons ce défaut de principe de l’INSEE pour mettre en relief les énergies primaires et secondaires réellement utilisées ou fournies.”) using average efficiency factors.

There are two sets of units: the black figures in MTEP (French for ‘million tons of oil equivalent’ MTOE) and the blue figures in MWh. Even though the flows are drawn with rectangles, one can grasp the general direction from top to bottom/top to left and losses to the bottom right by means of small arrows on the bands themselves. The width of flows seems to be pretty much to scale. The whole diagram a bit overloaded, with a high information density. Nevertheless, it caught my attention…
Sankey Diagrams with Color Gradients

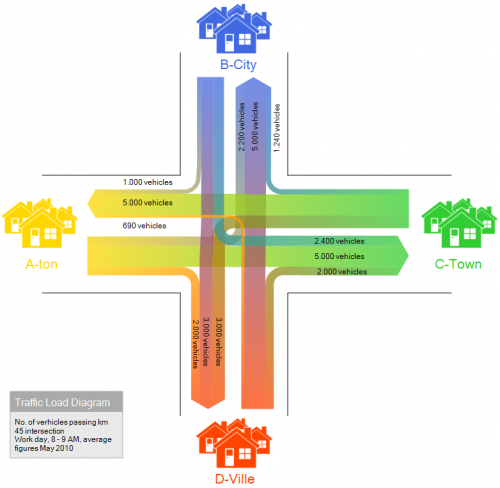
Color gradients seem to be the new like for Sankey diagrams. I already featured an example in yesterday’s post. The new e!Sankey 3.1 version has a color gradient feature now as well.

This diagram is taken from the samples included in the trial version. Traffic flows at a fictitious highway intersection is shown with the number of cars going from A to B, A to C, and so on.

It is not new at all (see this post) but has been pimped and now sports the color effect and some icons. Nice!

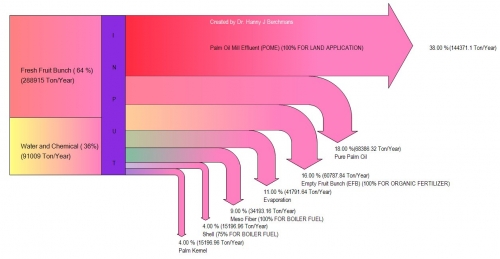
Sankey Diagram Maker by HJ Berchmans

The release of a new tool for Sankey diagrams has passed almost unnoticed. Dr. Hanny J. Berchmans has developed Sankey Diagram Maker and provides it as freeware on Google Docs.

This very basic tool can be used to produce simple Sankey diagrams that have a left-to-right layout and breakouts to the bottom as the above. Data values are fed as text file (CSV format). Colors can be set individually and nice color gradient effects are possible.

I have added Sankey Diagram Maker to the software list.

Energy Balance of Bavaria 2008

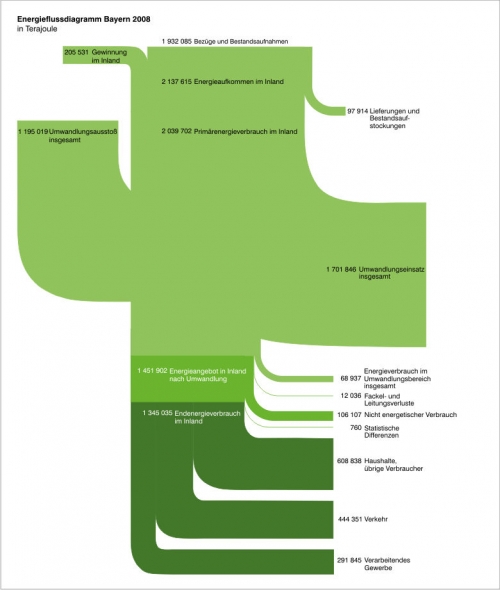
Found this Energy Flow Diagram for Bavaria (Germany) on the Bavarian Ministry of Economy website.

Flows are in Terajoule (TJ). Flows from top to bottom with different consuming sectors like private houdholds, traffic and industry. Different shades of green… 😉

While I generally welcome the fact that these Sankey diagrams are published for nations, regions or states (as is the case here / more examples can be found here on the blog!), I find that care must be taken to respect the basic principles used for these diagrams.

In that respect the above example looks somewhat quirky to me. The reason for this diagram being spoiled is the fat stream (1.195.019 TJ “Umwandlungsverluste insgesamt” – not sure what that means though) merging into the vertical band from the left, and its counterpart (1.701.846 TJ “Umwandlungseinsatz insgesamt”) branching out to the right at more or less the same height. Are these additional inputs and outputs? But then, why do they cross the main direction of the flow? Not clear to me…

Not a good example. I would have expected better from the state where two of my favourite cars are manufactured.

Grieger Family Personal Energy Balance

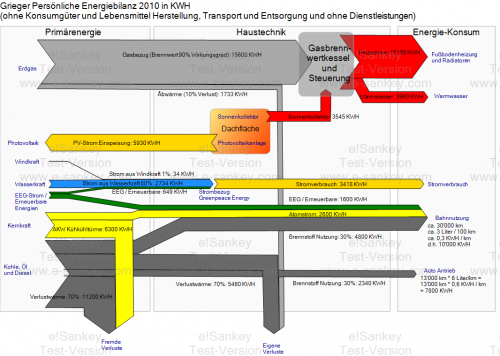
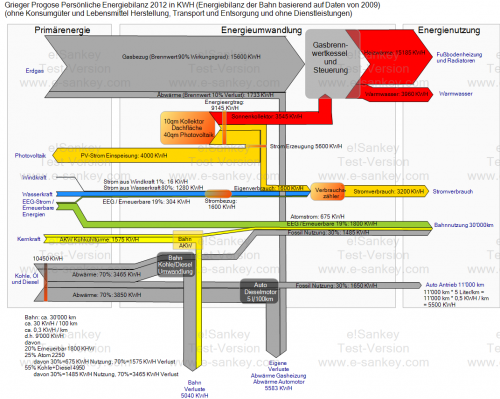
The “personal” energy balance of the Grieger family home for 2010 and a forecast for 2012 were presented in two blog posts here and here on Klaus Grieger’s blog.

All consumptions are traced back to the primary energy demand and include losses (dark rey arrows) in power generation by using efficiency factors.

2010

2012 forecast

The details of these Sankey diagrams are probably most interesting for those who understand German.

A PV system on the roof of the Grieger house permitted to feed back 5930 KWh of electric energy to the grid in 2010. In 2012 some of this energy is used directly (“Eigenverbrauch”), leading to a reduced energy bill for electricity purchased. Note that the Grieger family gets “green power” from hydro, wind and other renewables.

Another change between 2010 and 2012 is an updated mix of energies German Rail use (nuclear, coal and gas fired power plants).

Note that the two diagrams do not have the same scale. The consumption of heat is the same in 2010 and the 2012 forecast, so is primary energy demand from natural gas (grey arrow “Erdgas” at the top). Still, the 2012 Sankey arrows are wider than in the 2010 version. It would be nice to have the two Sankey diagrams side-by-side and be able to compare them by looking at the arrows widths.

Canada Energy Flows

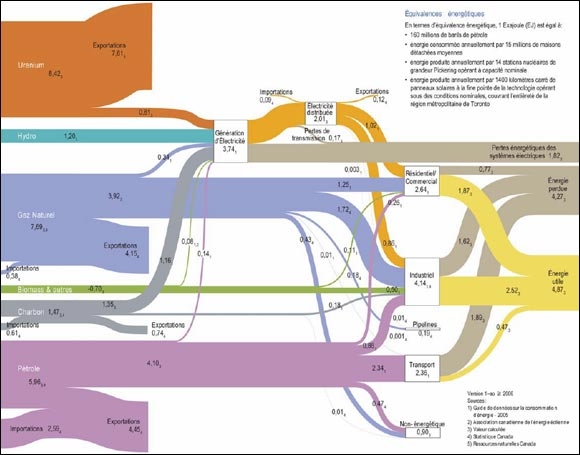
From a briefing document ‘Global and Canadian Context for Energy Demand Analysis – Energy Briefing Note’ (original source: ‘Powerful Connections: Priorities and Directions in Energy Science and Technology in Canada, Natural Resources Canada, 2006’) available on the National Energy Board website comes this Sankey diagram for Canadian Energy Flows in 2008:

Barely legible, but flow quantities are in Exajoule (EJ). The large bands that end about a quarter of the way are ‘exports’. Only the flows that go through to the power generation and consuming sectors represent domestic energy consumption.

Online plant measurement

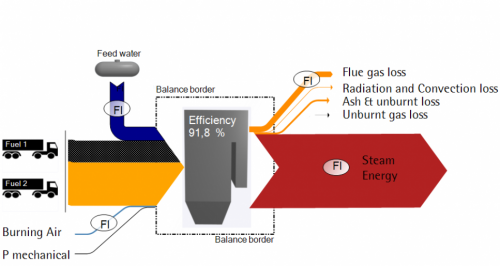
Indmeas, an engineering firm based in Espoo, Finland, provides a tool for on-line efficiency calculation and optimizing plant operation. Their data can be visualized using Sankey diagrams.

Small, but nice. Unfortunately neither units nor quantities in this schematic sample pic I took from their website.