Author: phineas

Swiss Biomass Sankey Diagrams

Gabor Doka pointed me to a publication by the Swiss EPA (Federal Office for the Environment, FOEN). The publication titled “Biogene Güterflüsse der Schweiz 2006” (‘Flows of biogenic goods in Switzerland in 2006’) features many different Sankey diagrams. “Biogenic goods are defined as goods of biological origin, excluding those of fossil origin”. Data is based on Swiss statistical figures and valid for 2006. Available in German only (Download PDF 7,5 MB).

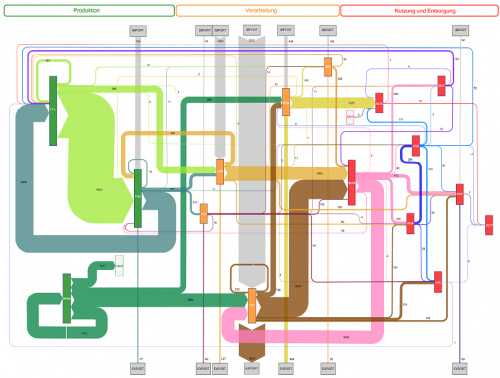
The overall structure of biomass flows is given in a generic layout and as Sankey diagrams with proportional arrow magnitudes for mass flows (unit is in 1000 tons, based on dry matter) as well as for energy content (in GWh, based on lower heat value of dry matter). These overview diagrams are structured in three columns ‘Production’, ‘Conversion’, and ‘Use/Disposal’. Imports are from top, exports to the bottom. This very clear structure for both mass and energy flows makes the complex diagrams easier to comprehend. These overview Sankey diagrams are available for download as a separate PDF file (still 3,2 MB)

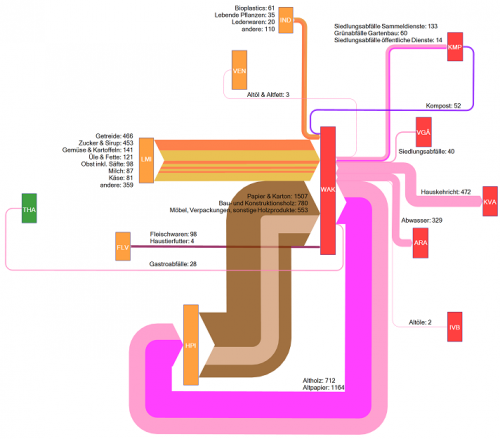
The main diagram is then broken down into individual Sankey diagrams for the different sectors involved, such as plant production (PLB), animal farming (THA), and forestry (WAW) in the production column (orange colored processes), or food industry (LMI) and wood/paper industry (HPI) in the conversion sector (green colored process). Finally, in the use/disposal sector (red colored processes) we find goods consumption (WAK) along with energy generation and waste treatments.

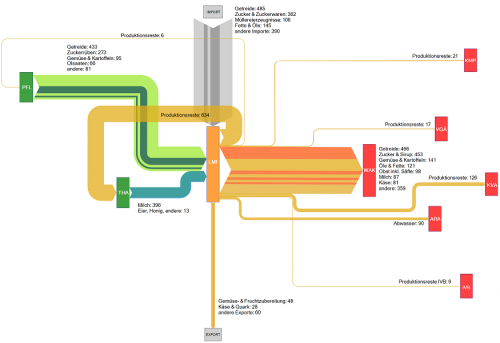
This is the sectoral Sankey diagram for the food industry in Switzerland. We can see that a large part of the biomass for food production is imported, and that most production wastes are fed back into animal farming again. The red boxes are different waste treatments receiving input from the food industry.

The above is the goods consumption section. Main biogenic goods inputs are from food industry and wood/paper industry. The meat input is rather small comparatively. A big chunk of the mass output (namely waste wood and waste paper) feeds back into the wood/paper industry. 472.000 tons ended up in waste incineration that year, some 329.000 tons in waste water.

The Sankey diagrams in the study are interesting to browse and reveal a lot more interesting facts. The stuctured approach with the breakdown into smaller diagrams is very useful. The authors Baier and Baum from ZHAW at Wädenswil have done a great job in compiling this.

“The results of this study will serve as useful decision aids for strategic planning and assessments concerning the potential, use and management of biogenic resources (…) makes it possible to detect quantitative changes that occurred during a given period of time and to reach conclusions concerning the efficiency of measures taken.

Actually this way of visualizing statistical data with directional (from-to) information attached to it could serve as a role model for other national mass and energy accounts, I think.

Uh – this has become my largest post ever 😮 . But I think this was well worth it and the publication merits it. Your comments appreciated.
Energy Balance of France

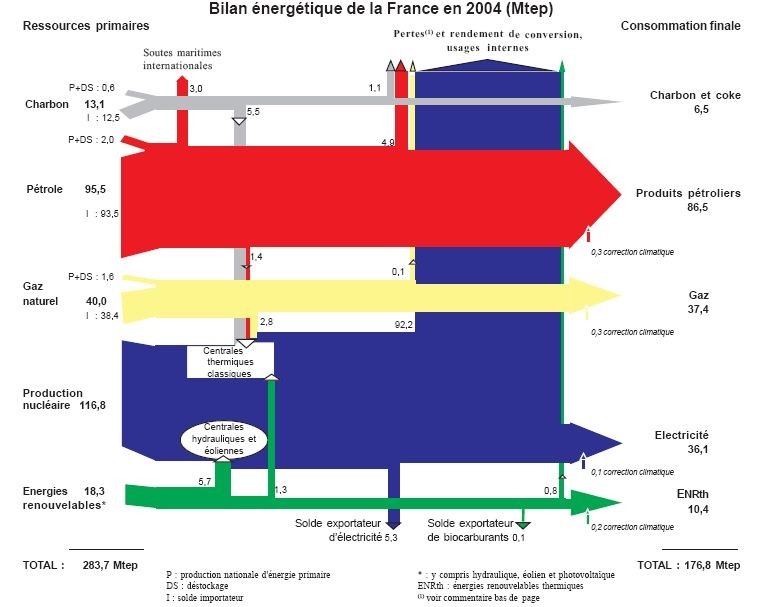
Found Sankey diagrams with the energy balances of France for several years, thanks to this Planète Bleue blog post.

These energy balances are apparently produced annually by French DGEC (Direction Général de Énergie et Climat) and are different from the energy flow Sankey diagrams for various countries I have shown here in other posts.

In these French energy balances the left side shows the primary energy (expressed in mégatonne équivalent pétrole Mtep, mega tonnes of oil equivalent Mtoe in English) broken down into the different sources, the right side shows the final consumption of energy with the same breakdown. The differences are the energy losses and internal consumption in energy generation.

The large losses for nuclear energy are explained in a footnote for the 2007 diagram, where it says that these can be attributed to the fact that ‘Observatoire de l’Énergie’ (OE) accounting standard is based on heat value:

L’importance des pertes dans le domaine de l’électricité tient largement au mode de calcul adopté depuis 2002 par l’OE: l’électricité d’origine nucléaire est comptabilisée, au niveau de la production, en termes de chaleur, dont les deux tiers sont perdus lors de la conversion en énergie
électrique

Nevertheless the Sankey diagram gives a good idea about the efficiency of energy generation for each of the different fuels and the energy mix for France.

For those of you who wish to compare the developments over the last years, here is what I have dug up so far:
2003 is shown on Planete Bleue in this post.
2004 is shown above
2006 can be found here on page 25 (PDF)
2007 can be found here on pages 6/7 (PDF)

Energy Management of Automobiles Sankey

Just returned from a short break … trying to get back into the regular blogging mode again. Here is a quick one from my bookmarks.

The Sankey diagram below illustrates a research project at Hannover University on energy management of automobiles. Similar to the Sankey diagram shown in this post it shows how total energy from gasoline is used in different components of a car.

The Sankey diagram is symbolic I assume, still one can see that large portions of the energy are lost in the exhaust gas (“Abgas”) and for motor cooling (“Kühler”). Flow quantities are given in Watt, not sure if that is per hour at a given speed or in idle mode.

Sankey diagrams on flickr (2)

I remember how a couple of years ago we used to play the board game ‘Settlers of Catan’ for hours and hours… I never got ’round to trying the computer game though.

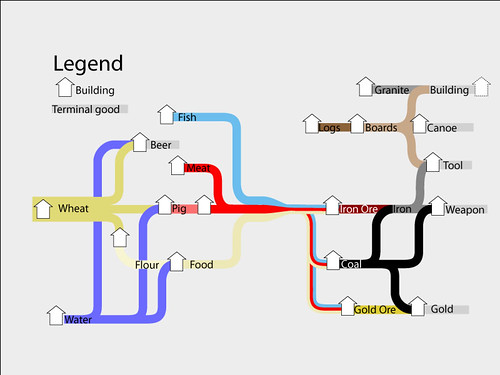
Now I was reminded of these times by a Sankey diagram “showing the resource chains in Settlers 2” that I found on flickr.

Brandel Zachernuk (go to ‘The Desk of Brendel Zachernuk’), who was so kind to give me permission to show his work of art here on the blog, wrote:

I only recently discovered the style of diagram as an approach and was quite surprised they aren’t more frequently used to explain resource flows.
I know that my diagram isn’t strictly a Sankey diagram because the width of the lines doesn’t correspond to anything …

Still, this is a lovely one, and it merits to be presented here! I admire the chain of developments men seems to have to go through: from water and fish and meat (hey, why no beer?) to nourishing people who produce iron ore, coal, tools, and eventually weapons. Some call it technological progress, others unsustainable use of natural ressources.

Sources and Beneficiaries of R&D Funding

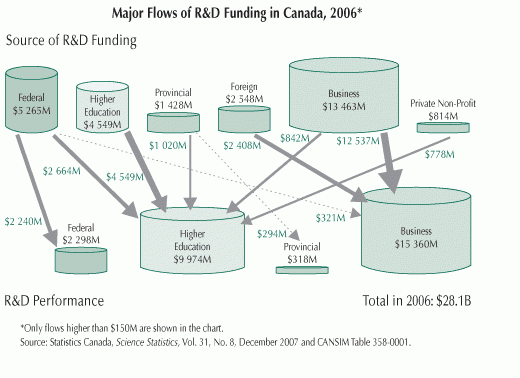
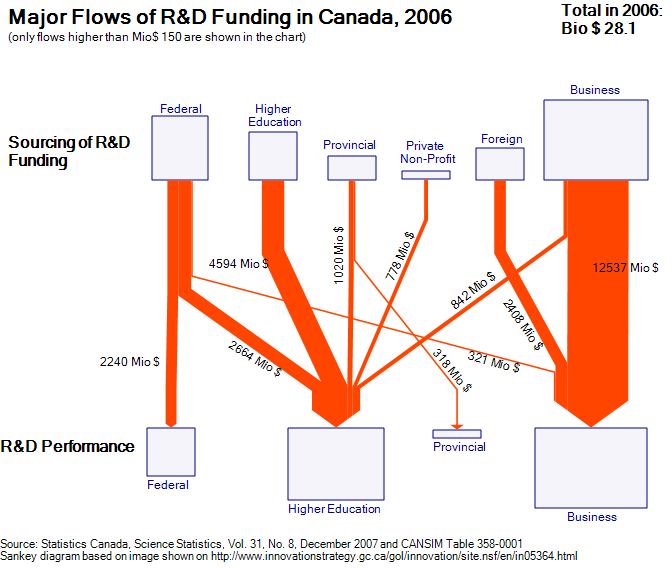
In early November I was pointed to an image on the Innovation Strategy Canada website [the website itself is not accessible any more] by a reader of this blog. Peter asked whether I know of any Sankey diagrams for financial flows, like they are shown in the one below.

The diagram visualizes the sources of R&D funding, and the institutions receiveing this funds. Data is from Statistics Canada for 2006 and shown in Mio (supposedly) Canadian Dollars.

While there are only four different arrow widths to show the financial flows, the interesting thing is that the sums of funds from each source and received by each beneficiary are shown as cylinders (database symbols, tanks, …).

I quickly did several versions of the diagram, but was not too happy with the results. The flow quantities are OK, but as it turns out, it is difficult to see the volume of the cylinder, supposedly to scale with the sums. This information is redundant anyway, since the width of the joined arrows at their base or at their head is exactly the sum that is supposedly to be shown by the cylinder volume.

Here is one version of my Sankey diagram for R&D funding in Canada for 2006 based on the original image. I decided to make the boxes in different sizes (the problem remains the same: can one immediately grasp the area of each box).

Your comments are welcomed. Is there a better way to display the sums?

Sankey Diagrams for Carbon Footprint

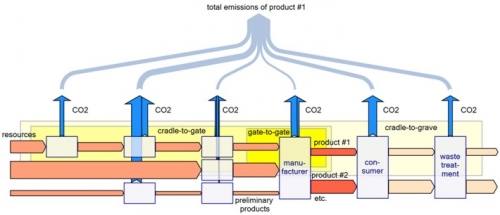
I was pointed to an article on carbon footprint, that used Sankey diagrams to underline a method of carbon accounting along the supply chain. This article was part of the “first virtual global conference on climate change” CLIMATE 2008 that took place, yes, exclusively on the Internet from November 3 to 7, 2008. (I must admit that this event passed largely unnoticed by me, although reading some of the papers now gives me the impression that it would have merited more attention.)

The paper titled “Carbon Accounting and Carbon Footprint – more than just diced results?” by Prof. Mario Schmidt from Pforzheim University describes the various approaches of corporate carbon accounting, carbon footprint of products, and Life Cycle Assessment LCA. Schmidt introduces a method that allows determining “cumulative emissions … at each point of the supply chain up to the POS”, and calls this the CO2 backpack.


The four Sankey diagrams above from the article illustrate the idea. They show (1) the CO2 equivalent emisisons along the supply chain, (2) the value added in a supply chain, (3) the relative CO2 emissions per value of product, and (4) the total emissions of the products along the supply chain with sectoral gate-to-gate, cradle-to-gate or crade-to-grave approaches.

This article is well worth reading, you should do so while it is still available online. Update: the domain has gone offline
Schmidt is an acclaimed expert in Sankey diagrams and has also published on the history and methodology of Sankey diagrams.

Visualizing Social Conditions

Came across densitydesign’s images on flickr and was really fascinated by the visualizations presented there.

Density Design is a research framework and an experimental laboratory, born as a laboratory course in the final year of the Master Degree Course in Communication Design at the Politecnico di Milano.

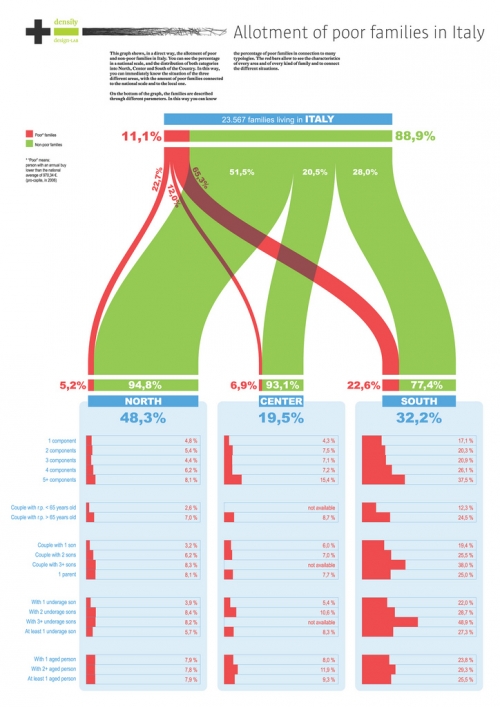
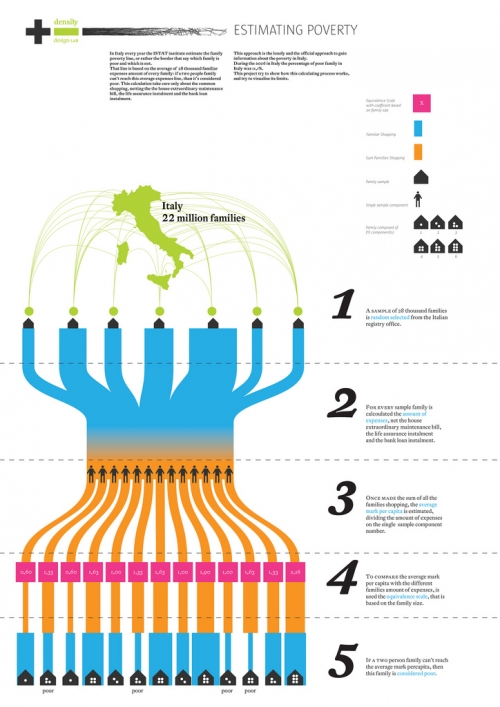
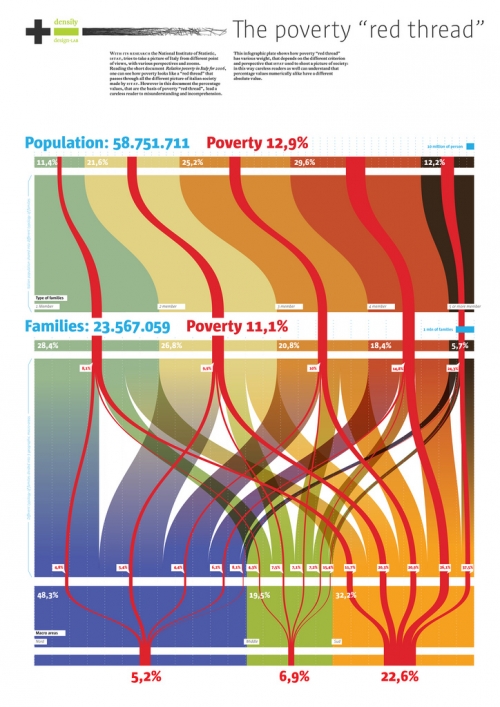
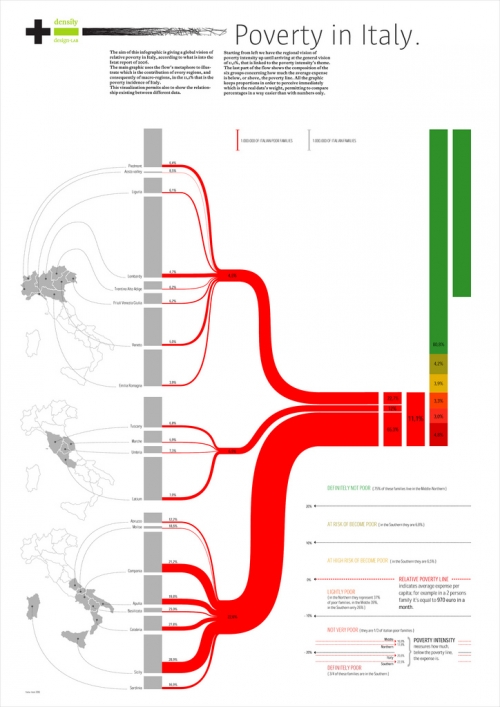
One of their recent projects was on social conditions and poverty in Italy. Some of the visualizations that were created in the course of this project resemble Sankey diagrams, and this is why I thought I should share them with you.


The designers had several dimensions of information they wanted to put into the visualization of statistical data on poverty in Italy. The four shown above chose bands of proportional widths to display the numbers rather than pie charts. In contrast to Sankey diagrams these are not flows, because they are not directed. The works by Luca Rossi (2nd above) and Elena Capolongo (4th above, my personal favourite) try to link the quantities to regions using a map of Italy.

A nice followup project would be to display the migration movements from Southern Italy to the North and abroad due to the social conditions, as previously reported about here.

Density Design has kindly granted permission to show these visualizations here. Read the summary (Project progress report 01. Economic statistic & Communication Design) and learn about their other projects on the Density Design blog. I am adding them to the blogroll too.

Lying with Sankey diagrams (3)

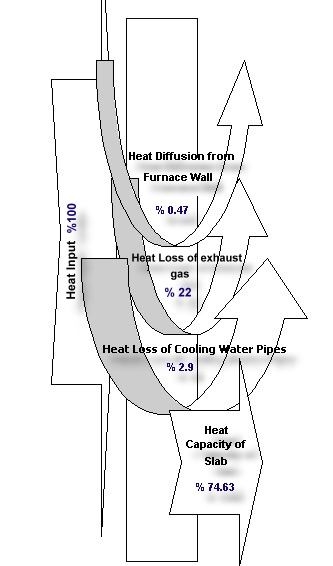
Found this Sankey-like diagram accompanying an abstract submitted for the 2001 International Conference on Thermal Engineering and Thermogrammetry. Posting it here on the blog before this site eventually vanishes. This Sankey diagram is a good example of how not to draw Sankey diagrams, I think. Or, as a Japanese friend would put it politely: “Maybe… [turn head at 30° degree angle, make slight air-sucking noise by inhaling through open mouth] … maybe not so good”.

Here’s the diagram:

The idea was to display heat losses at a slab furnace in a Turkish steel plant. Heat losses were identified in exhaust gases (22 %), at the cooling pipes (2.90 %), and at the furnace walls (0.47 %).

The fact that the widths of the arrows displaying the heat losses were chosen arbitrarily give a completely wrong idea of the proportions. The powerpointish curved arrows don’t really contribute to a better understanding.

All in all, not a very good one. Adding this to my “Lying with Sankey diagrams” mini series (see part 1, part 2), which has been neglected recently.